Omron 2015 Annual Report Download - page 11
Download and view the complete annual report
Please find page 11 of the 2015 Omron annual report below. You can navigate through the pages in the report by either clicking on the pages listed below, or by using the keyword search tool below to find specific information within the annual report.-
 1
1 -
 2
2 -
 3
3 -
 4
4 -
 5
5 -
 6
6 -
 7
7 -
 8
8 -
 9
9 -
 10
10 -
 11
11 -
 12
12 -
 13
13 -
 14
14 -
 15
15 -
 16
16 -
 17
17 -
 18
18 -
 19
19 -
 20
20 -
 21
21 -
 22
22 -
23
-
24
-
25
-
26
-
27
-
28
-
29
-
30
-
31
-
32
-
33
-
34
-
35
-
36
-
37
-
38
-
39
-
40
-
41
-
42
-
43
-
44
-
45
-
46
-
47
-
48
-
49
-
50
 |
 |

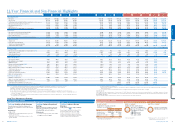
OMRON Corporation and Subsidiaries (As of and for the years ended March 31)
11-Year Financial and Non-Financial Highlights
1st Stage Establish a Profit Structure
Concentrate on cost structure reform and
restructure the Company as a profit-generating
business
Achievements
ROE of 10%
Withdrew from unprofitable business, spun off
Healthcare Business
Raised the level of corporate governance to the
global standard
2nd Stage Balance Growth and
Earnings
Reinforce business foundations through
aggressive investment in growth areas,
including M&A, and cost reduction
Achievements
Increased earnings per share from ¥110.7
(FY2003) to ¥185.9 (FY2007)
3rd Stage Achieve a Growth
Structure
Fortify growth businesses (high profitability)
Revival Stage (February 2009 to March 2011)
Revised 3rd-stage targets due to an abrupt
change in the business environment, imple-
mented cost reductions, and spun off Automo-
tive Electronic Components Business and Social
Systems, Solutions and Service Business
Millions of yen Thousands of
U.S. dollars (Note 1)
FY2004 FY2005 FY2006 FY2007 FY2008 FY2009 FY2010 FY2011 FY2012 FY2013 FY2014 FY2014
Operating Results:
Net sales ¥598,727 ¥616,002 ¥723,866 ¥762,985 ¥627,190 ¥524,694 ¥617,825 ¥619,461 ¥650,461 ¥772,966 ¥847,252 $7,060,433
Gross profit 245,298 248,642 278,241 293,342 218,522 184,342 231,702 227,887 241,507 297,208 332,607 2,771,725
Selling, general and administrative expenses (excl. R&D expenses) 141,185 149,274 164,167 176,569 164,284 133,426 142,365 145,662 152,676 181,225 198,103 1,650,858
Research and development expenses 49,441 50,501 52,028 51,520 48,899 37,842 41,300 42,089 43,488 47,928 47,913 399,275
Operating income (Note 2) 54,672 60,782 62,046 65,253 5,339 13,074 48,037 40,136 45,343 68,055 86,591 721,592
EBITDA (Note 3) 83,314 91,607 95,968 101,596 38,835 40,088 71,021 62,753 67,795 93,144 114,930 957,750
Net income (loss) attributable to shareholders 30,176 35,763 38,280 42,383 (29,172)3,518 26,782 16,389 30,203 46,185 62,170 518.083
Cash Flows:
Net cash provided by operating activities 61,076 51,699 40,539 68,996 31,408 42,759 41,956 31,946 53,058 79,044 77,057 642.142
Net cash used in investing activities (36,050) (43,020) (47,075) (36,681) (40,628) (18,584) (20,210) (26,486) (28,471) (31,125)(39,517) (329,308)
Free cash flow (Note 4) 25,026 8,679 (6,536)32,315 (9,220)24,175 21,746 5,460 24,587 47,919 37,540 312,833
Net cash provided by (used in) financing activities (40,684) (38,320) (4,697) (34,481)21,867 (20,358) 3,333 (33,492) (18,550) (16,298)(29,303) (244,192)
Financial Position:
Total assets 585,429 589,061 630,337 617,367 538,280 532,254 562,790 537,323 573,637 654,704 711,011 5,925,092
Cash and cash equivalents 80,619 52,285 42,995 40,624 46,631 51,726 74,735 45,257 55,708 90,251 102,622 855,183
Total interest-bearing liabilities 23,203 2,468 19,988 18,179 52,970 36,612 45,519 18,774 5,570 488 0 0
Total shareholders’ equity 305,810 362,937 382,822 368,502 298,411 306,327 312,753 320,840 366,962 430,509 489,769 4,081,408
Yen U.S. dollars (Note 1)
Per Share Data:
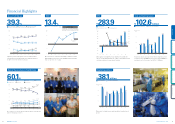
Net income (loss) attributable to shareholders (EPS) 126.5 151.1 165.0 185.9(132.2)16.0 121.7 74.5 137.2 209.8283.9 2.37
Shareholders’ equity 1,284.8 1,548.1 1,660.7 1,662.3 1,355.4 1,391.4 1,421.0 1,457.5 1,667.0 1,956.12,254.4 18.79
Cash dividends (Note 5) 24.0 30.0 34.0 42.0 25.0 17.0 30.0 28.0 37.0 53.071.0 0.59
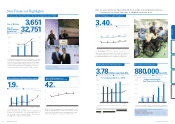
Dividend payout ratio 19.2%19.9%20.6%22.6%106.4%24.7%37.6%27.0%25.3%25.0%
Financial Indicators:
Gross profit margin 41.0%40.4%38.4%38.4%34.8%35.1%37.5%36.8%37.1%38.5%39.3%
Operating income margin 9.1%9.9%8.6%8.6%0.9%2.5%7.8%6.5%7.0%8.8%10.2%
EBITDA margin 13.9%14.9%13.3%13.3%6.2%7.6%11.5%10.1%10.4%12.1%13.6%
Return on invested capital (ROIC) 9.0%10.1%9.9%10.4% (7.6%) 1.0%7.8%4.8%8.6%11.3%13.4%
Return on equity (ROE) 10.4%10.7%10.3%11.3% (8.7%) 1.2%8.7%5.2%8.8%11.6%13.5%
Ratio of shareholders’ equity to total assets 52.2%61.6%60.7%59.7%55.4%57.6%55.6%59.7%64.0%65.8%68.9%
Total return ratio (Note 6) 29.1%47.8%49.7%74.7%106.7%25.2%37.7%27.0%25.3%49.1%
Capital expenditures 38,579 40,560 44,447 37,072 36,844 19,524 23,192 28,341 28,285 33,653 38,143 317,858
Depreciation and amortization 28,642 30,825 33,922 36,343 33,496 27,014 22,984 22,617 22,452 25,089 28,339 236,158
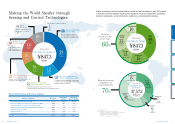
Ratio of overseas sales 39.9%43.4%47.3%52.1%49.7%50.7%51.4%52.2%51.1%55.4%60.1%
Non-Financial Data (Note 7) :
Number of employees 24,904 27,408 32,456 35,426 32,583 36,299 35,684 35,992 35,411 36,842 37,572
Ratio of overseas employees to total employees 58.4%61.1%64.9%65.7%63.4%68.1%67.8%67.7%67.4%69.1%69.7%
Number of patents held (Note 8) 4,426 4,538 5,206 5,717 5,205 5,218 5,452 5,959 6,448 6,635 7,194
Environmental contribution (ton-CO2) (Note 9) 216,467 211,364 331,222 671,953 880,561
CO2 emissions of global production sites (ton-CO2) (Note 10) 191,103 183,953 176,055 207,426 223,945
FY2001 – FY2003 FY2004 – FY2007 FY2011 – FY2013 FY2014 – FY2016 FY2017 – FY2020
Long-Term Management Strategy
Grand Design 2010 GD2010Value Generation 2020 VG2020
FY2008 – FY2010
Notes: 1. U.S. dollar amounts represent translations of Japanese yen at the approximate exchange rate on March 31, 2015 of ¥120 = U.S.$1.
2. Operating income for fiscal 2005 includes an ¥11,915 million gain recorded on the return of pension assets to the government.
3. EBITDA = Operating income + Depreciation and amortization
4. Free cash flow = Net cash provided by operating activities + Net cash used in investing activities
5. Cash dividends per share represent the amounts applicable to the respective year, including dividends to be paid after the end of the fiscal year.
6. Total return ratio = (Total dividends paid + Amount of shares repurchased) / Net income (loss) attributable to shareholders (does not include repurchases of
less than one trading unit)
7. The non-financial data presented herein was reviewed by Deloitte Tohmatsu Evaluation and Certification Organization Co., Ltd., an independent practitioner.
See page 92 for more information.
Operating Income
Omron applies the single step presentation of income under U.S. GAAP (that is, the various levels of income are not presented) in its consolidated statements of income.
For comparison with other companies, operating income is presented as gross profit less selling, general and administrative expenses and research and development expenses.
Discontinued Operations
Figures for FY2006 and prior years have been restated to account for businesses discontinued in FY2007.
EARTH-2 STAGEEARTH-1 STAGE
Establish self-driven growth structure
FY2020
Targets*3
FY2016
Targets*2
GLOBE STAGE
Establishment of profit and growth
structures on a global basis
Target*1Result
Net sales ¥750.0 billion ¥773.0 billion
Operating income ¥100.0 billion ¥68.
1 billion
Gross profit margin 42.0%38.5%
Operating income margin 13.3%8.8%
ROE over 15%11.6%
*1 Target values are those announced at the time of the original
VG2020 announcement (July 2011)
*2 Announced April 2014 *3 Target values are those announced at the time of the
original VG2020 announcement (July 2011)
● Net sales over ¥900 billion
● Gross profit margin over 40%
● Operating profit margin
over
10%
● ROIC approx. 13%
● ROE approx. 13%
● EPS approx. ¥290
● Net sales over ¥1 trillion
● Operating profit margin15%
8. Patent information is as of March 15.
9. Environmental contribution = Volume of CO2 emissions reduction contributed by society’s use of the Omron Group’s energy-saving, storage, or generation
products and services.
10. CO2 emissions volumes calculated based on fuel consumption and electricity purchase volumes by the Company.
Integrated Report 2015 19
18 OMRON Corporation
About Omron Where We’re Headed Corporate Value Initiatives Corporate Value Foundation Financial Section