O'Reilly Auto Parts 2014 Annual Report Download - page 4
Download and view the complete annual report
Please find page 4 of the 2014 O'Reilly Auto Parts annual report below. You can navigate through the pages in the report by either clicking on the pages listed below, or by using the keyword search tool below to find specific information within the annual report.-
 1
1 -
 2
2 -
 3
3 -
 4
4 -
 5
5 -
 6
6 -
 7
7 -
 8
8 -
 9
9 -
 10
10 -
 11
11 -
 12
12 -
 13
13 -
 14
14 -
 15
15 -
16
-
17
-
18
-
19
-
20
-
21
-
22
-
23
-
24
-
25
-
26
-
27
-
28
-
29
-
30
-
31
-
32
-
33
-
34
-
35
-
36
-
37
-
38
-
39
-
40
-
41
-
42
-
43
-
44
-
45
-
46
-
47
-
48
-
49
-
50
-
51
-
52
-
53
-
54
-
55
-
56
-
57
-
58
-
59
-
60
-
61
-
62
-
63
-
64
-
65
-
66
-
67
-
68
-
69
-
70
-
71
-
72
-
73
-
74
-
75
-
76
-
77
-
78
-
79
-
80
-
81
-
82
-
83
-
84
-
85
-
86
-
87
-
88
-
89
-
90
 |
 |

O’REILLY AUTOMOTIVE 2014 ANNUAL REPORT
3
As the average age a high quality vehicle can stay on the road
grows, so does the miles driven and required maintenance
on these vehicles, supporting continued strong demand in
our industry.
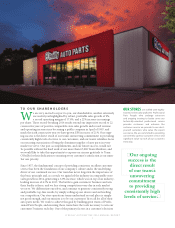
Sustainable, protable top-line growth by itself is simply not
enough, and another important O’Reilly culture value is
the relentless practice of expense control. At Team O’Reilly,
expense control goes beyond scrutinizing our expenditures;
instead, it is a laser-focus on deploying our shareholders’ in-
vestments in activities which will ultimately improve service
levels to our customers and enhance their experience each
time they walk into or call one of our stores. We take a long-
term perspective when it comes to expense control, and our
commitment to consistently-superior customer service has
been rewarded with industry-leading comparable store sales.
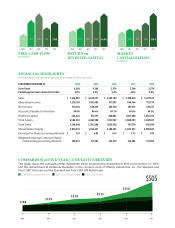
Our expense control focus has translated our consistent top-
line growth into bottom line prots, and we once again set a
company record, high-operating prot margin of 17.6% of
sales in 2014.
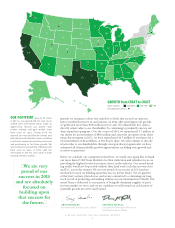
Our priorities for the use of our capital remain unchanged:
our primary focus is reinvestment in our business by main-
taining and enhancing our existing store base and distribu-
tion network, expanding our footprint through greeneld
store openings and consolidating the market by acquiring
existing auto parts chains and converting them to our mod-
el. 2014 was another great year in execution of this playbook
with the successful opening of 200 net, new stores across
38 dierent states, including our rst store in Pennsylvania,
and the opening of three new DCs. e single biggest factor
to the success of a new store is the quality of the store team,
and we aggressively identify and develop knowledgeable
and enthusiastic Professional Parts People who are eager to
provide unsurpassed customer service in each new store.
We are able to successfully instill the O’Reilly culture to new
store teams across the U.S. because of the vast aermarket
experience we have amassed throughout our company and
our dedication to promoting new leaders from within our
ranks. We have been very pleased with the performance of
our new store openings over the past several years and are
very condent we will replicate this success in the additional
205 new stores we plan to open in 2015, supported by our 26
regional distribution centers, including the three we opened
in 2014. Our ability to bring additional DC capacity online
eectively, without missing a beat in providing exceptional
service to our stores, is a huge driver to our success. At the
end of 2014, our distribution system had the capacity to
support an additional 800 stores across our footprint, and
we are well positioned to continue our record of protable
growth. While we did not make a signicant strategic ac-
quisition in 2014, we continually monitor the landscape for
potential acquisition targets and will pursue opportunities
that can achieve the appropriate return on our investment
and drive our long-term protable growth.
Supported by the strength and stability of the long-term
drivers for demand in the automotive aermarket and
driven by our relentless focus on protable long-term
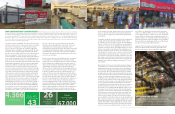
43
States with
O’Reilly stores
O’Reilly stores
4,366
26
O’Reilly
distribution
centers
O’Reilly
Team Members
more than
67 000
,
FROM GROUND BREAKING TO GRAND OPENING Before breaking ground, we strategically select sites for new stores by considering,
among other factors, local population density and demographics, as well as local registered vehicles and automotive repair facilities. Our stores are
generally freestanding buildings or prominent end caps situated on or near major trac thoroughfares, which oer ample parking, easy customer access
and average approximately 7,200 square feet. Our store design features high ceilings, convenient interior layouts, in-store signage, bright lighting, and
dedicated counters to serve our professional service provider customers. After construction is completed, our stores are stocked with an average of
23,000 SKUs, which includes a wide selection of nationally recognized, well-advertised, premium name brand products, as well as proprietary private label
products for domestic and imported automobiles.
OUR DISTRIBUTION NETWORK is a robust, regional,
tiered distribution model that provides our stores with industry-
leading parts availability. Our distribution centers are strategically
located close to our stores which allows us to service them ve
nights a week.
DC 22, Phoenix, AZ, taken by O’Reilly Team Member Rick Rowen, Systems Analyst.
O’REILLY AUTOMOTIVE 2014 ANNUAL REPORT
2
Photos provided by O’Reilly Store Installations team
to purchase a part is availability; if we do not have the part
a customer needs, or if we cannot get the part to a customer
faster than our competitors, we risk losing the business.
A key to our success has been our sustained competitive
advantage in parts availability, an advantage built through
our robust, tiered, regional supply chain network, which
provides our store teams with access to the right part faster
than our competitors. We stock each of our stores with
robust inventories consisting of high-quality parts tailored
to the needs of the market served by each individual store.
Each one of our store’s inventories is customized based on
numerous factors including vehicle registration data, market
demographic information, and local customer purchasing
patterns. In addition to individually-tailored store level
inventories, most of our store teams also have same-day
access to a larger assortment of hard-to-nd parts through
our hub store network made up of 283 strategically-located
stores that stock larger inventories, which average 41,000
SKUs, and, for our stores located in markets surrounding
one of our 26 strategically-deployed distribution centers
(DC), directly from one of our DCs, which average 146,000
SKUs. Our stores also receive ve-night-a-week inventory
replenishment from our DCs. is frequent and exible
replenishment model allows us to stock a larger breadth of
store level inventory, increasing the chance we will either
have a part in stock at the store for immediate fulllment
of our customer’s needs or have the part quickly available.
Our ability to customize and rapidly deploy inventory is a
powerful resource when a do-it-yourself customer walks
into one of our stores or a professional service provider
customer calls needing that hard-to-nd part. We are not
satised, however, with resting on our laurels, and we
continually evaluate methods which will enhance our ability
to strategically and eectively deploy our inventory invest-
ment, allowing us to maintain our competitive advantage
and extend our tradition of providing unsurpassed levels of
service to our customers.
Our 22 consecutive years of protable growth is a testament
to our ability to successfully execute our proven model
during both strong and dicult macroeconomic conditions,
and we remain very condent in the long-term drivers of
demand in the automotive aermarket. e primary driver
of demand in our industry is the total number of miles
driven in the U.S. Supported by improving employment lev-
els, through November of 2014, the number of miles driven
in the U.S. in 2014 increased 1.4%. While temporary eco-
nomic conditions can incrementally pressure miles driven
over short periods of time, we believe the long-term outlook
for miles driven growth remains solid and will continue to
provide a strong foundation for demand in our industry. As
we have seen for several years now, the higher quality of
new cars manufactured and sold over the past two decades
has also benetted the automotive aermarket. With proper
maintenance, these high-quality vehicles can be reliably
driven at higher mileages, resulting in stable scrappage rates
and, coupled with solid new car sales, an increase in the
total U.S. vehicle population and the average age of vehicles.