O'Reilly Auto Parts 2014 Annual Report Download - page 2
Download and view the complete annual report
Please find page 2 of the 2014 O'Reilly Auto Parts annual report below. You can navigate through the pages in the report by either clicking on the pages listed below, or by using the keyword search tool below to find specific information within the annual report.-
 1
1 -
 2
2 -
 3
3 -
 4
4 -
 5
5 -
 6
6 -
 7
7 -
 8
8 -
 9
9 -
 10
10 -
 11
11 -
 12
12 -
 13
13 -
14
-
15
-
16
-
17
-
18
-
19
-
20
-
21
-
22
-
23
-
24
-
25
-
26
-
27
-
28
-
29
-
30
-
31
-
32
-
33
-
34
-
35
-
36
-
37
-
38
-
39
-
40
-
41
-
42
-
43
-
44
-
45
-
46
-
47
-
48
-
49
-
50
-
51
-
52
-
53
-
54
-
55
-
56
-
57
-
58
-
59
-
60
-
61
-
62
-
63
-
64
-
65
-
66
-
67
-
68
-
69
-
70
-
71
-
72
-
73
-
74
-
75
-
76
-
77
-
78
-
79
-
80
-
81
-
82
-
83
-
84
-
85
-
86
-
87
-
88
-
89
-
90
 |
 |

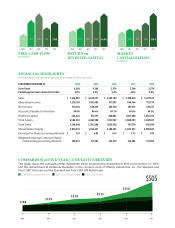
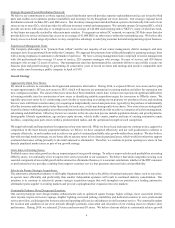
FINANCIAL HIGHLIGHTS
In thousands, except earnings per share data and store count
YEAR ENDED DECEMBER 31, 2014 2013 2012 2011 2010
Store Count 4,366 4,166 3,976 3,740 3,570
Percentage Increase in Same-Store Sales 6.0% 4.3% 3.8% 4.6% 8.8%
Sales $ 7,216,081 $ 6,649,237 $ 6,182,184 $ 5,788,816 $ 5,397,525
Operating Income 1,270,374 1,103,485 977,393 866,766 712,776
Net Income 778,182 670,292 585,746 507,673 419,373
Accounts Payable to Inventory 94.6% 86.6% 84.7% 64.4% 44.3%
Working Capital 236,422 412,191 460,083 1,027,600 1,072,294
Total Assets 6,540,301 6,067,208 5,749,187 5,500,501 5,047,827
Total Debt 1,396,640 1,396,208 1,095,956 797,574 358,704
Shareholders’ Equity 2,018,418 1,966,321 2,108,307 2,844,851 3,209,685
Earnings Per Share (assuming dilution) $ 7.34 $ 6.03 $ 4.75 $ 3.71 $ 2.95
Weighted-Average Common Shares
Outstanding (assuming dilution) 106,041 111,101 123,314 136,983 141,992
MARKET
CAPITALIZATION
(in billions)
2010 2011 2012 2013 2014
$8.5 $10.2 $10.1 $13.6 $19.6
FREE CASH FLOW
(in millions)
2010 2011 2012 2013 2014
$338 $791 $951 $512 $760
RETURN on
INVESTED CAPITAL
2010 2011 2012 2013 2014
13.1% 16.7% 20.8% 23.6% 26.9%
COM PA R ISON of FIVE-YEAR CUMULATIVE RETURN
This graph shows the cumulative total shareholder return assuming the investment of $100 on December, 31, 2009,
and the reinvestment of dividends thereafter, in the common stock of O’Reilly Automotive, Inc., the Standard and
Poor’s S&P 500 Index and the Standard and Poor’s S&P 500 Retail Index.
2009 2010 2011 2012 2013 2014
$100 $159 $210 $235
$338
$505
O’Reilly Automotive, Inc. S&P 500 IndexS&P 500 Retail Index