O'Reilly Auto Parts 2014 Annual Report Download - page 13
Download and view the complete annual report
Please find page 13 of the 2014 O'Reilly Auto Parts annual report below. You can navigate through the pages in the report by either clicking on the pages listed below, or by using the keyword search tool below to find specific information within the annual report.-
 1
1 -
2
-
 3
3 -
 4
4 -
 5
5 -
 6
6 -
 7
7 -
 8
8 -
 9
9 -
 10
10 -
 11
11 -
 12
12 -
 13
13 -
 14
14 -
 15
15 -
 16
16 -
 17
17 -
 18
18 -
 19
19 -
 20
20 -
 21
21 -
 22
22 -
 23
23 -
24
-
25
-
26
-
27
-
28
-
29
-
30
-
31
-
32
-
33
-
34
-
35
-
36
-
37
-
38
-
39
-
40
-
41
-
42
-
43
-
44
-
45
-
46
-
47
-
48
-
49
-
50
-
51
-
52
-
53
-
54
-
55
-
56
-
57
-
58
-
59
-
60
-
61
-
62
-
63
-
64
-
65
-
66
-
67
-
68
-
69
-
70
-
71
-
72
-
73
-
74
-
75
-
76
-
77
-
78
-
79
-
80
-
81
-
82
-
83
-
84
-
85
-
86
-
87
-
88
-
89
-
90
 |
 |

FORM 10-K
6
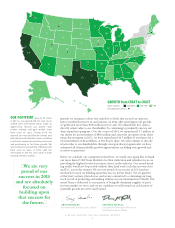
The following table sets forth the geographic distribution and activity of our stores as of December 31, 2014 and 2013:
December 31, 2013 2014 Net, New and
Acquired Stores December 31, 2014
State
Store
Count
% of Total
Store Count
Store
Change
% of Total
Store Change
Store
Count
% of Total
Store Count
Cumulative
% of Total
Store Count
Texas 603 14.5 % 12 6.0 % 615 14.1 % 14.1%
California 498 12.0 % 14 7.0 % 512 11.7 % 25.8%
Missouri 185 4.4 % 5 2.5 % 190 4.4 % 30.2%
Georgia 173 4.2 % 5 2.5 % 178 4.1 % 34.3%
Illinois 159 3.8 % 8 4.0 % 167 3.8 % 38.1%
Tennessee 148 3.6 % 5 2.5 % 153 3.5 % 41.6%
Washington 147 3.5 % 4 2.0 % 151 3.5 % 45.1%
Ohio 130 3.0 % 18 9.0 % 148 3.4 % 48.5%
North Carolina 133 3.2 % 8 4.0 % 141 3.2 % 51.7%
Michigan 120 2.9 % 14 7.0 % 134 3.1 % 54.8%
Arizona 131 3.1 % 2 1.0 % 133 3.1 % 57.9%
Florida 90 2.2 % 28 14.0 % 118 2.7 % 60.6%
Oklahoma 115 2.8 % 1 0.5 % 116 2.7 % 63.3%
Minnesota 112 2.7 % 3 1.5 % 115 2.6 % 65.9%
Alabama 113 2.7 % 1 0.5 % 114 2.6 % 68.5%
Indiana 104 2.5 % 5 2.5 % 109 2.5 % 71.0%
Arkansas 102 2.4 % 2 1.0 % 104 2.4 % 73.4%
Wisconsin 95 2.3 % 9 4.5 % 104 2.4 % 75.8%
Louisiana 96 2.3 % 4 2.0 % 100 2.3 % 78.1%
Colorado 86 2.1 % 4 2.0 % 90 2.1 % 80.2%
South Carolina 78 1.9 % 6 3.0 % 84 1.9 % 82.1%
Kansas 74 1.8 % 2 1.0 % 76 1.7 % 83.8%
Mississippi 72 1.7 % 1 0.5 % 73 1.7 % 85.5%
Iowa 68 1.6 % 2 1.0 % 70 1.6 % 87.1%
Kentucky 67 1.6 % 0 0.0 % 67 1.5 % 88.6%
Utah 57 1.4 % 2 1.0 % 59 1.4 % 90.0%
Oregon 52 1.3 % 6 3.0 % 58 1.3 % 91.3%
Virginia 46 1.1 % 8 4.0 % 54 1.2 % 92.5%
Nevada 50 1.2 % 2 1.0 % 52 1.2 % 93.7%
New Mexico 44 1.1 % 1 0.5 % 45 1.0 % 94.7%
Idaho 34 0.8 % 2 1.0 % 36 0.8 % 95.5%
Maine 35 0.8 % 0 0.0 % 35 0.8 % 96.3%
Nebraska 32 0.7 % 3 1.5 % 35 0.8 % 97.1%
Montana 24 0.6 % 3 1.5 % 27 0.6 % 97.7%
New Hampshire 18 0.4 % 0 0.0 % 18 0.4 % 98.1%
Wyoming 17 0.4 % 1 0.5 % 18 0.4 % 98.5%
North Dakota 13 0.3 % 2 1.0 % 15 0.3 % 98.8%
Alaska 13 0.3 % 1 0.5 % 14 0.3 % 99.1%
Hawaii 12 0.3 % 0 0.0 % 12 0.3 % 99.4%
South Dakota 12 0.3 % 0 0.0 % 12 0.3 % 99.7%
Massachusetts 3 0.1 % 4 2.0 % 7 0.2 % 99.9%
West Virginia 5 0.1 % 1 0.5 % 6 0.1 % 100.0%
Pennsylvania 0 0.0 % 1 0.5 % 1 — % 100.0%
Total 4,166 100.0% 200 100.0% 4,366 100.0%