O'Reilly Auto Parts 2013 Annual Report Download - page 6
Download and view the complete annual report
Please find page 6 of the 2013 O'Reilly Auto Parts annual report below. You can navigate through the pages in the report by either clicking on the pages listed below, or by using the keyword search tool below to find specific information within the annual report.-
 1
1 -
 2
2 -
 3
3 -
 4
4 -
 5
5 -
 6
6 -
 7
7 -
 8
8 -
 9
9 -
 10
10 -
 11
11 -
 12
12 -
 13
13 -
 14
14 -
 15
15 -
 16
16 -
 17
17 -
18
-
19
-
20
-
21
-
22
-
23
-
24
-
25
-
26
-
27
-
28
-
29
-
30
-
31
-
32
-
33
-
34
-
35
-
36
-
37
-
38
-
39
-
40
-
41
-
42
-
43
-
44
-
45
-
46
-
47
-
48
-
49
-
50
-
51
-
52
-
53
-
54
-
55
-
56
-
57
-
58
-
59
-
60
-
61
-
62
-
63
-
64
-
65
-
66
-
67
-
68
-
69
-
70
-
71
-
72
-
73
-
74
-
75
-
76
-
77
-
78
-
79
-
80
-
81
-
82
-
83
-
84
-
85
-
86
-
87
-
88
-
89
-
90
-
91
-
92
-
93
-
94
-
95
 |
 |

O’REILLY AUTOMOTIVE 2013 ANNUAL REPORT 8
We are also committed to managing
our capital structure to provide robust
returns for shareholders, while prudently
preserving our ability to invest in our
business and take advantage of growth
opportunities. To this end, we established
a targeted leverage ratio of 2.00 to 2.25
times adjusted debt to adjusted EBITDAR
at the beginning of 2011, which we believe
reects our current optimal capital
structure, and we issued additional debt
in June of 2013 in line with this target.
With this issuance we had intended to
enter our target range in 2013, but did not
because of our very strong earnings
results and we nished 2013 just below
that range. Our continued strong
performance and prudent nancial
management earned us an upgrade in our
credit rating from Moody’s during 2013,
moving the rating from Baa3 up to Baa2,
and putting us on par with our BBB at
rating from S&P. Our investment grade
ratings are a critical component of our
overall capital structure and supplier
nancing programs, and we remain
extremely committed to maintaining
these ratings.
Our nal priority for use of cash, aer we
have exhausted opportunities to invest in
our business, is to return value to our
shareholders in the form of our share
repurchase program. In 2013, our strong
free cash ow results and incremental
debt issuance supported share repurchases
totaling $933 million. Since the inception
of our Board-approved share repurchase
program in January of 2011, we have
repurchased more than 40 million of our
shares, at an average price of $82.61 per
share, for a total investment of $3.35
billion. We believe this program has
created signicant value for our
shareholders, and we will continue to
prudently repurchase shares with excess
cash in 2014.
We remain very grateful to all of our
shareholders for the continued trust you
have placed in O’Reilly. We are very proud
of our record-breaking performance in
2013 and remain committed to building
upon this success in 2014 and beyond.
Finally, we would once again like to thank
our 62,000 Team Members for their
unwavering passion for oering the
highest level of customer service in the
industry. You are the reason for our past
success and our very bright future.
aermarket landscape for the right
acquisition target, but we will only buy
at the right price – one that meets our
stringent return metrics. We do not
pursue acquisitions solely for the sake of
growth. Once a deal is completed, our
operations groups work diligently to
quickly convert the physical plant of the
acquired chain to O’Reilly’s systems,
processes and procedures. Most
importantly, however, we work from
day one of the acquisition to instill the
O’Reilly Culture in each of our new Team
Members. Our ability to successfully
spread our Culture in acquisitions ranging
in size from one store to 1,300 stores is the
single most important factor in our past
and future acquisition successes.
Financial Policy We are laser focused on
executing our proven protable growth
model and our nancial policies reect
that commitment. Our priorities for use
of cash mirror our growth strategies with
the top priority being investment in our
existing store base to provide our teams
with attractive stores, robust inventory
availability and enhanced technology
to capture market share, followed by
new store growth and opportunistic
acquisitions. In 2013, we successfully
followed this playbook, capturing market
share and generating industry leading
4.3% comparable store sales growth,
while opening 190 new stores. is
topline execution, along with disciplined
expense control, generated free cash ow
of $512 million in 2013.
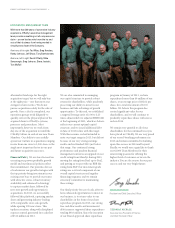
GREG HENSLEE
President and Chief Executive Officer
THOMAS MCFALL
Executive Vice President of Finance
and Chief Financial Officer
EXPERIENCED MANAGEMENT TEAM
With more than 300 years of automotive industry
experience, O’Reilly’s executive management
team provides something not all companies can
claim – proven leaders who know the ins and
outs of their business from having worked in
virtually every facet of the Company.
Front row, left to right: Ted Wise, Greg Henslee,
Randy Johnson, Jeff Shaw, Tony Bartholomew
Back row, left to right: David O’Reilly, Mike
Swearengin, Greg Johnson, Steve Jasinski,
Tom McFall