O'Reilly Auto Parts 2013 Annual Report Download - page 2
Download and view the complete annual report
Please find page 2 of the 2013 O'Reilly Auto Parts annual report below. You can navigate through the pages in the report by either clicking on the pages listed below, or by using the keyword search tool below to find specific information within the annual report.-
 1
1 -
 2
2 -
 3
3 -
 4
4 -
 5
5 -
 6
6 -
 7
7 -
 8
8 -
 9
9 -
 10
10 -
 11
11 -
 12
12 -
 13
13 -
14
-
15
-
16
-
17
-
18
-
19
-
20
-
21
-
22
-
23
-
24
-
25
-
26
-
27
-
28
-
29
-
30
-
31
-
32
-
33
-
34
-
35
-
36
-
37
-
38
-
39
-
40
-
41
-
42
-
43
-
44
-
45
-
46
-
47
-
48
-
49
-
50
-
51
-
52
-
53
-
54
-
55
-
56
-
57
-
58
-
59
-
60
-
61
-
62
-
63
-
64
-
65
-
66
-
67
-
68
-
69
-
70
-
71
-
72
-
73
-
74
-
75
-
76
-
77
-
78
-
79
-
80
-
81
-
82
-
83
-
84
-
85
-
86
-
87
-
88
-
89
-
90
-
91
-
92
-
93
-
94
-
95
 |
 |

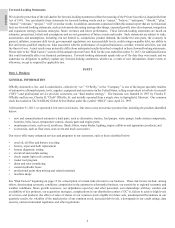
O’Reilly’s wheels remain in motion. In 2013, Team O’Reilly delivered another year of
record-breaking results driven by our relentless commitment to our proven dual market
strategy and our unwavering dedication to the O’Reilly Culture of hard work and excellent
customer service. During 2013, we launched O’Rewards, our new customer loyalty
program, we opened our milestone 4,000th store and we continued the expansion of our
robust distribution network by beginning construction on three new state-of-the-art DCs,
which will open in key, existing and expansion markets. Every member of Team O’Reilly
is dedicated to keeping our satised customers’ wheels in motion.
WHEELS in MOTION
P
R
O
F
E
S
S
I
O
N
A
L
C
U
S
T
O
M
E
R
S
D
O
I
T
Y
O
U
R
S
E
L
F
C
U
S
T
O
M
E
R
S
TEAM
O’REILLY
T E C H N O L O G Y
M A R K E T I N G
S T O R E S
C U S T O M E R
SERVICE
DISTRIBUTION
NETWORK
REGIONAL, TIERED DISTRIBUTION NETWORK
24 STRATEGICALLY LOCATED FACILITIES
266 HUB STORES
UNPARALLELED CUSTOMER SERVICE
HIGHLY-TRAINED PROFESSIONAL PARTS PEOPLE
ROBUST ELECTRONIC CATALOG
O’REWARDS LOYALTY PROGRAM
42 STATES, COAST TO COAST
4,000TH STORE MILESTONE
190 NEW STORES IN 2013
NATIONAL BRAND AWARENESS
EVENT SPONSORSHIPS
RADIO, SOCIAL MEDIA &
IN-STORE PROMOTIONS
PRODUCT MIX
MARKET SPECIFIC STORE-LEVEL INVENTORY
FLEET, HEAVY DUTY & AGRICULTURE
PAINT, BODY & EQUIPMENT
INFINITY PARTS SYSTEM
FIRST CALL ONLINE
OREILLYAUTO.COM
O’REILLY AUTOMOTIVE 2013 ANNUAL REPORT 1
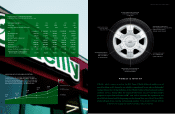
FINANCIAL HIGHLIGHTS
In thousands, except earnings per share data and store count
YEARS ENDED DECEMBER 31, 2013 2012 2011 2010 2009
Store Count 4,166 3,976 3,740 3,570 3,421
Percentage Increase in Same-Store Sales 4.3% 3.8% 4.6% 8.8% 4.6%
Sales $ 6,649,237 $ 6,182,184 $ 5,788,816 $ 5,397,525 $ 4,847,062
Operating Income 1,103,485 977,393 866,766 712,776 537,619
Net Income 670,292 585,746 507,673 419,373 307,498
Accounts Payable to Inventory 86.6% 84.7% 64.4% 44.3% 42.8%
Working Capital 412,191 460,083 1,027,600 1,072,294 1,007,576
Total Assets 6,067,208 5,749,187 5,500,501 5,047,827 4,781,471
Total Debt 1,396,208 1,095,956 797,574 358,704 790,748
Shareholders’ Equity 1,966,321 2,108,307 2,844,851 3,209,685 2,685,865
Earnings Per Share (assuming dilution) $ 6.03 $ 4.75 $ 3.71 $ 2.95 $ 2.23
Weighted-Average Common Shares
Outstanding (assuming dilution) 111, 101 123,314 136,983 141,992 137,882
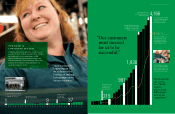
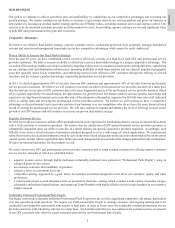
COMPARISON OF FIVE-YEAR CUMULATIVE RETURN
This graph shows the cumulative total shareholder return
assuming the investment of $100 on December, 31, 2008, and
the reinvestment of dividends thereafter, in the common stock
of O’Reilly Automotive, Inc., the Standard and Poor’s S&P 500
Index and the Standard and Poor’s S&P 500 Retail Index.
$100
2008
$124
2009
$197
2010
$260
2011
$291
2012
O’Reilly Automotive, inc.
S&P 500 Index
S&P 500 Retail Index
$419
2013