O'Reilly Auto Parts 2013 Annual Report Download - page 3
Download and view the complete annual report
Please find page 3 of the 2013 O'Reilly Auto Parts annual report below. You can navigate through the pages in the report by either clicking on the pages listed below, or by using the keyword search tool below to find specific information within the annual report.-
 1
1 -
 2
2 -
 3
3 -
 4
4 -
 5
5 -
 6
6 -
 7
7 -
 8
8 -
 9
9 -
 10
10 -
 11
11 -
 12
12 -
 13
13 -
 14
14 -
15
-
16
-
17
-
18
-
19
-
20
-
21
-
22
-
23
-
24
-
25
-
26
-
27
-
28
-
29
-
30
-
31
-
32
-
33
-
34
-
35
-
36
-
37
-
38
-
39
-
40
-
41
-
42
-
43
-
44
-
45
-
46
-
47
-
48
-
49
-
50
-
51
-
52
-
53
-
54
-
55
-
56
-
57
-
58
-
59
-
60
-
61
-
62
-
63
-
64
-
65
-
66
-
67
-
68
-
69
-
70
-
71
-
72
-
73
-
74
-
75
-
76
-
77
-
78
-
79
-
80
-
81
-
82
-
83
-
84
-
85
-
86
-
87
-
88
-
89
-
90
-
91
-
92
-
93
-
94
-
95
 |
 |

O’REILLY AUTOMOTIVE 2013 ANNUAL REPORT 3O’REILLY AUTOMOTIVE 2013 ANNUAL REPORT 2
It is our pleasure to report another year
of outstanding nancial results to you,
our shareholders, and we would like to
thank our dedicated Team Members for
once again outworking our competitors
and providing the best customer service
in the industry. We entered the year with
a long tradition of excellent nancial
performance, having generated
comparable store sales growth and
increases in revenues and operating
margin each year since becoming a public
company in 1993, and in 2013 Team
O’Reilly stepped up to the plate and
delivered another record breaking year.
Our nancial performance in 2013 was
highlighted by a robust 27% increase in
diluted earnings per share – our h
consecutive year of 25% or greater
adjusted earnings per share growth.
2013 Results At the core of our team’s
ability to out-pace our industry year in
and year out is our unwavering,
unrelenting commitment to customer
service; however, our robust sales
performance certainly does not come
easily and our passion for taking care of
every customer was the driving force
behind our industry leading comparable
store sales growth of 4.3%. Although the
U.S. economy has shown some signs of a
modest recovery, our customer continues
to face pressure from historically high
unemployment and underemployment,
and the competition for their business is
erce. is challenging economic
environment has constrained the overall
growth in the automotive aermarket, as
evident in the number of miles driven in
the U.S. and the reported results of our
public competitors. Our team’s ability to
deliver solidly positive comparable store
sales growth, while the rest of the
marketplace struggles to remain at, is a
clear indication we are capturing market
share. Our performance leads our
industry simply because we provide the
best customer service – it is ingrained in
the ber of the Team O’Reilly Culture.
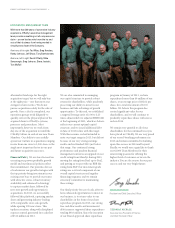
at Culture is no more evident than in
our commitment to promote from within.
Our executive and senior management
teams have average tenures of 23 and 16
years in our company, respectively, and a
signicant majority of these managers
started in our business in a customer
service position in one of our stores.
e leadership of our company has grown
up in the parts business…and it shows.
Our excellent customer service is not
a program or a corporate initiative, it
is the hard-earned product of the years
of experience we have in oering
our customers great advice and great
parts, every day. We have repeatedly
demonstrated our ability to successfully
perpetuate our Culture as we open new
stores and integrate acquisitions –
Excellent Customer Service is simply
who we are, and it will remain at the
heart and soul of our Company.
Another key component of the O’Reilly
Culture is our relentless expense control
focus, which, coupled with our strong and
protable sales growth, drove a 13%
increase in operating prot to a record
16.6% as a percentage of sales. To provide
a little historical perspective, the 16.6%
operating margin result is a 450 basis
point improvement over our 12.1%
operating margin from just six years ago.
Our outstanding results have been driven
by our commitment to protable growth
and are the result of our discipline in
pursuing growth – we capture market
share by providing better service, building
long-term relationships and do not buy
business with price. Our improved
protability in 2013 mirrored our
long-term strategy. We drove improved
gross margins by demonstrating the value
for both our customers and suppliers; our
customers beneted from our excellent
service levels and technical knowledge,
and we continue to see a higher mix of
hard part sales, which carry a higher gross
prot, while our supplier partners have
shared the gains they have reaped from
our robust growth in improved
acquisition costs. Our operating discipline
extends to the management of our
operating expenses. Our strategy is to
improve the productivity of our operating
expenses over the long term by leveraging
our costs on improved sales volumes,
however, we have not and will not
sacrice the service we provide to our
customers to drive short-term
improvements in our numbers.
and we expect for this trend to continue.
We are also optimistic about the
increasing trend in new vehicle sales.
Stronger new car sales point to improving
consumer condence and overall
economic health and, combined with
stable, low scrappage rates, leads to a
growing population of total vehicles.
Unemployment improved modestly in
2013 and we expect to continue to see
steady improvements in commuter miles
as the economy recovers and more
individuals return to work. An increasing
population of vehicles and total miles
driven in the U.S. are strong catalysts for
increased demand for the parts we sell
and we remain extremely condent in the
long-term prospects of the aermarket.
Growing Market Share Against the
backdrop of strong automotive
aermarket fundamentals, we are poised
to continue to outpace our industry by
executing our proven growth strategy.
e most important component to that
strategy has been, and will continue to be,
growing our market share in existing
stores by simply outworking our
competitors and providing better
customer service. Our dual market
business model of serving both
professional service providers and
do-it-yourselfers with the best inventory
availability and knowledgeable parts
professionals has proven to be the most
eective model in our industry, and the
most dicult to duplicate. Our robust,
regional, tiered distribution infrastructure
enables us to provide ve-night-a-week
delivery service to our stores,
supplemented in the majority of our
stores with multiple daily deliveries of
must-have parts from our local
distribution center or hub store. is
robust distribution network reects a
signicant capital investment, but the
Future Outlook As we look forward to
2014, we will continue to execute our
business model and growth strategies with
the goal of setting new records for growth
and protability. We remain very
condent in the health of the automotive
aermarket, principally supported by the
stability of miles driven and continued
aging of the vehicle eet. Vehicles
manufactured today can be reasonably
expected to stay on the road at high
mileages because of the quality of the
power trains, interiors and exteriors, and,
as a result, vehicle owners are willing to
invest in routine maintenance and repairs
on older vehicles with an expectation that
their vehicle will remain a reliable source
of transportation. is combination of the
durability of vehicles, and the value
proposition it creates for consumers,
continues to push out the age at which
vehicles are sent to the junk yard, and has
resulted in very stable scrappage rates,
T O O U R
SHAREHOLDERS
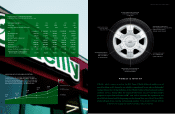
DILUTED EARNINGS
PER SHARE
FREE CASH FLOW
(in millions)
RE TURN ON
INVESTED CAPITAL
20.8%
$951
$4.75
15.8%
3.8%
16.7%
$791
$3.71
15.0%
4.6% 13.1%
$338
$2.95
13.2%
8.8%
10.8%
($130)
$2.23
11.1%
4.6%
OPERATING INCOME AS A
PERCENTAGE OF SALES
09 10 11 12 1309 10 11 12 1309 10 11 12 1309 10 11 12 1309 10 11 12 13
10 20 81,000
815 6
600
600
6
4
10 4400
25 2
200
0
0 0 0 -200
4.3%
16.6% $6.03 $512
23.6%
SAME-STORE SALES
percentage increase)
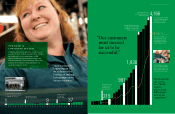
O’Rewards, our customer loyalty
program launched in 2013,
rewards our retail customers with
enhanced benets including cash
discounts o future purchases,
member-only oers and surprise
and delight targeted promotions.
More than four million loyal
customers have already enrolled in
our O’Rewards program and are
enjoying their well-earned benets.
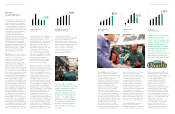
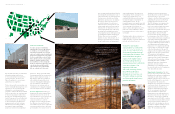
Our stores oer an extensive
selection of automotive parts, tools,
supplies, equipment, accessories,
and enhanced services and
programs to both do-it-yourself
and professional service provider
customers. Our highly-trained,
technically-procient Professional
Parts People are committed to
providing consistently superior
service to each of our customers
every day.
25
20
15
10
5
0