O'Reilly Auto Parts 2001 Annual Report Download - page 16
Download and view the complete annual report
Please find page 16 of the 2001 O'Reilly Auto Parts annual report below. You can navigate through the pages in the report by either clicking on the pages listed below, or by using the keyword search tool below to find specific information within the annual report.-
 1
1 -
2
-
3
-
4
-
5
-
 6
6 -
 7
7 -
 8
8 -
 9
9 -
 10
10 -
 11
11 -
 12
12 -
 13
13 -
 14
14 -
 15
15 -
 16
16 -
 17
17 -
 18
18 -
 19
19 -
 20
20 -
 21
21 -
 22
22 -
 23
23 -
 24
24 -
 25
25 -
 26
26 -
27
-
28
-
29
-
30
-
31
-
32
-
33
-
34
-
35
-
36
-
37
-
38
-
39
-
40
 |
 |

O’REILLY AUTOMOTIVE 2001 ANNUAL REPORT
A MODEL YEAR
Page 14
(a) The number of stores at year-end 1992 are net of the combinations of two
stores located within one mile of each other. Two stores were closed
during 1997, one was closed in 1998 and one was closed in 2000. No
other stores were closed during the periods presented. Additionally,
seven former Hi/LO stores located in California were sold in 1998.
(b) Total square footage includes normal selling, office, stockroom and
receiving space. Weighted-average product sales per store and per
square foot are weighted to consider the approximate dates of store
openings or expansions.
(c) Same-store product sales data are calculated based on the change in
product sales of only those stores open during both full periods being
compared. Percentage increase in same-store product sales is calculated
based on store sales results, which exclude sales of specialty machinery,
sales by outside salesmen and sales to employees.
(d) Beginning January 2000, same-store product sales data are calculated
based on the change in product sales of stores open at least one year.
Percentage increase in same-store product sales is calculated based on
store sales results, which exclude sales of specialty machinery, sales by
outside salesmen and sales to employees.
(e) There was no additional dilution until 1993 when options were first granted.
(f) 1998 does not include stores acquired from Hi/LO. Consolidated weighted-
average product sales per square foot were $207.3.
SELECTED CONSOLIDATED FINANCIAL DATA (CONTINUED)
(In thousands, except selected operating data)
YEARS ENDED DECEMBER 31, 2001 2000 1999 1998 1997 1996 1995 1994 1993 1992
SELECTED OPERATING DATA:
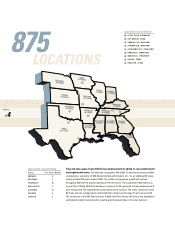
Number of stores at year-end(a) 875 672 571 491 259 219 188 165 145 127
Total store square footage at year-end (in 000’s)(b) 5,882 4,491 3,777 3,172 1,454 1,155 923 785 671 571
Weighted-average product sales per
store (in 000’s)(b) $1,425 $1,412 $ 1,423 $ 1,368 $ 1,306 $ 1,239 $ 1,101 $ 1,007 $ 949 $ 838
Weighted-average product sales per
square foot (b) (f) $213.0 $212.6 $ 216.5 $ 238.0 $ 235.8 $ 242.2 $ 227.3 $ 215.4 $ 208.7 $ 187.2
Percentage increase in same-store
product sales open two full periods(c) 8.2% 4.0% 9.6% 6.8% 6.8% 14.4% 8.9% 8.9% 14.9% 11.4%
Percentage increase in same-store
product sales open one year(d) 8.8% 5.0%
BALANCE SHEET DATA:
Working capital $429,527 $296,272 $249,351 $208,363 $ 93,763 $ 74,403 $ 80,471 $ 41,416 $ 41,193 $ 15,251
Total assets 856,859 715,995 610,442 493,288 247,617 183,623 153,604 87,327 73,112 58,871
Short-term debt 16,843 49,121 19,358 13,691 130 3,154 231 311 495 3,462
Long-term debt, less current portion 165,618 90,463 90,704 170,166 22,641 237 358 461 732 2,668
Long-term debt related to discontinued
operations, less current portion –––––––––9,873
Shareholders’ equity $556,291 $463,731 $403,044 $218,394 $182,039 $155,782 $ 133,870 $ 70,224 $ 57,805 $ 29,281