O'Reilly Auto Parts 2000 Annual Report Download - page 2
Download and view the complete annual report
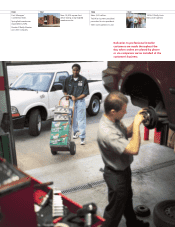
Please find page 2 of the 2000 O'Reilly Auto Parts annual report below. You can navigate through the pages in the report by either clicking on the pages listed below, or by using the keyword search tool below to find specific information within the annual report.-
 1
1 -
 2
2 -
 3
3 -
 4
4 -
 5
5 -
 6
6 -
 7
7 -
 8
8 -
 9
9 -
 10
10 -
 11
11 -
 12
12 -
 13
13 -
14
-
15
-
16
-
17
-
18
-
19
-
20
-
21
-
22
-
23
-
24
-
25
-
26
-
27
-
28
-
29
-
30
-
31
-
32
-
33
-
34
-
35
-
36
-
37
-
38
-
39
-
40
 |
 |

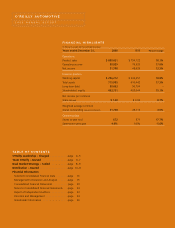
FINANCIAL HIGHLIGHTS
(In thousands, except per share and operating data)
Years ended December 31, 2000 1999 Percent Change
Operations
Product sales $ 890,421 $ 754,122 18.1%
Operating income 90,029 76,920 17.0%
Net income 51,708 45,639 13.3%
Financial position
Working capital $ 296,272 $ 249,351 18.8%
Total assets 715,995 610,442 17.3%
Long-term debt 90,463 90,704 –
Shareholders’ equity 463,731 403,044 15.1%
Net income per common
share (diluted) $ 1.00 $ 0.92 8.7%
Weighted average common
shares outstanding (assuming dilution) 51,728 49,715 4.0%
Operating data
Stores at year end 672 571 17.7%
Same-store sales gain 4.0% 9.6% -5.6%
O’REILLY AUTOMOTIVE
2000 ANNUAL REPORT
TABLE OF CONTENTS
O’Reilly Leadership – Charged . . . . . . . . . . . .page 4–5
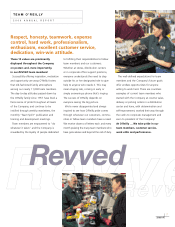
Team O’Reilly – Revved . . . . . . . . . . . . . . . . .page 6–7
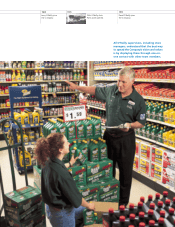
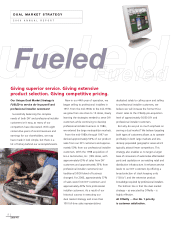
Dual Market Strategy – Fueled . . . . . . . . . . .page 8–9
Distribution – Geared . . . . . . . . . . . . . . . . . . .page 10–11
Financial Information
Selected Consolidated Financial Data . . . . . . . .page 13
Management’s Discussion and Analysis . . . . . .page 15
Consolidated Financial Statements . . . . . . . . . .page 20
Notes to Consolidated Financial Statements . . .page 24
Report of Independent Auditors . . . . . . . . . . . .page 33
Directors and Management . . . . . . . . . . . . . . .page 34
Shareholder Information . . . . . . . . . . . . . . . . .page 36