O'Reilly Auto Parts 2000 Annual Report Download - page 17
Download and view the complete annual report
Please find page 17 of the 2000 O'Reilly Auto Parts annual report below. You can navigate through the pages in the report by either clicking on the pages listed below, or by using the keyword search tool below to find specific information within the annual report.-
 1
1 -
2
-
3
-
4
-
5
-
6
-
 7
7 -
 8
8 -
 9
9 -
 10
10 -
 11
11 -
 12
12 -
 13
13 -
 14
14 -
 15
15 -
 16
16 -
 17
17 -
 18
18 -
 19
19 -
 20
20 -
 21
21 -
 22
22 -
 23
23 -
 24
24 -
 25
25 -
 26
26 -
 27
27 -
28
-
29
-
30
-
31
-
32
-
33
-
34
-
35
-
36
-
37
-
38
-
39
-
40
 |
 |

2000 AR
15
The following discussion of our financial condition, results of operations
and liquidity and capital resources should be read in conjunction
with our consolidated financial statements, related notes and other
financial information included elsewhere in this annual report.
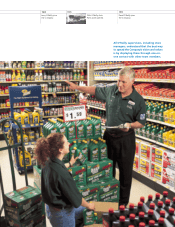
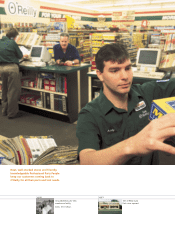
We are one of the largest specialty retailers of automotive aftermarket
parts, tools, supplies, equipment and accessories in the United States,
selling our products to both do-it-yourself (“DIY”) customers and
professional installers. Our stores carry an extensive product line
consisting of new and remanufactured automotive hard parts,
maintenance items and accessories, and a complete line of autobody
paint and related materials, automotive tools and professional
service equipment.
Beginning in January 2000, we calculate same-store product sales
based on the change in product sales for stores open at least one
year. We also calculate same-store product sales based on the
change in product sales of only those stores open during both full
periods being compared. We calculate the percentage increase in
both same-store product sales based on store sales results, which
exclude sales of specialty machinery, sales by outside salesmen and
sales to employees.
Cost of goods sold consists primarily of product costs and warehouse
and distribution expenses. Cost of goods sold as a percentage of
product sales may be affected by variations in our product mix,
price changes in response to competitive factors and fluctuations
in merchandise costs and vendor programs.
Operating, selling, general and administrative expenses consist
primarily of store payroll, store occupancy, advertising expenses,
other store expenses and general and administrative expenses,
including salaries and related benefits of corporate employees,
administrative office occupancy expenses, data processing,
professional expenses and other related expenses.
MANAGEMENT’S DISCUSSION AND ANALYSIS OF
FINANCIAL CONDITION AND RESULTS OF OPERATIONS
O’REILLY AUTOMOTIVE
$ 0
(millions)
1999
$ 45.6
1998
$ 30.8
1997
$ 23.1
1996
$ 19.0 1995
$ 14.1
2000
$ 51.7
$ 10
$ 20
$ 30
$ 40
$ 50
$ 60
Net
Income
$ 0
(millions)
1999
$ 754.1
1998
$ 616.3
1997
$ 316.4 1996
$ 259.2 1995
$ 201.5
2000
$ 890.4
$ 200
$ 400
$ 600
$ 800
$ 1000
$ 1200
Product
Sales
$ 0
(millions)
1999
$ 610.4
1998
$ 493.3
1997
$ 247.6 1996
$ 183.6
1995
$ 153.6
2000
$ 716.0
$ 200
$ 400
$ 600
$ 800
$ 1000
$ 1200
Total
Assets
$ 0
(millions)
1999
$ 403.0
1998
$ 218.4 1997
$ 182.0 1996
$ 155.8 1995
$ 133.9
2000
$ 463.7
$ 100
$ 200
$ 300
$ 400
$ 500
$ 600
Share-
holders'
Equity