Nutrisystem 2006 Annual Report Download - page 10
Download and view the complete annual report
Please find page 10 of the 2006 Nutrisystem annual report below. You can navigate through the pages in the report by either clicking on the pages listed below, or by using the keyword search tool below to find specific information within the annual report.-
 1
1 -
 2
2 -
 3
3 -
 4
4 -
 5
5 -
 6
6 -
 7
7 -
 8
8 -
 9
9 -
 10
10 -
 11
11 -
 12
12 -
 13
13 -
 14
14 -
 15
15 -
 16
16 -
 17
17 -
 18
18 -
 19
19 -
 20
20 -
 21
21 -
22
-
23
-
24
-
25
-
26
-
27
-
28
-
29
-
30
-
31
-
32
-
33
-
34
-
35
-
36
-
37
-
38
-
39
-
40
-
41
-
42
-
43
-
44
-
45
-
46
-
47
-
48
-
49
-
50
-
51
-
52
-
53
-
54
-
55
-
56
-
57
-
58
-
59
-
60
-
61
-
62
-
63
-
64
-
65
-
66
-
67
-
68
-
69
-
70
-
71
-
72
-
73
-
74
-
75
-
76
 |
 |

Competitive Stren
g
th
s
We believe that our s
y
stem offers consumers a sensible approach to losin
g
wei
g
ht without the use o
f
f
addish, unhealth
y
or unrealistic wei
g
ht loss methods. We intend to capitalize on the followin
g
competitive
strengt
h
s to grow:
P
roduct E
ff
icac
y
.
We believe our customers are very satisfied with our products and believe they have lost
we
i
g
h
tw
hil
eus
i
ng our program. A customer survey con
d
ucte
db
yt
h
e Nat
i
ona
l
Bus
i
ness Researc
h
Inst
i
tute
in
December 200
5
found that clients lost an avera
g
e of 19.4 pounds in
j
ust under 12 weeks on the NutriS
y
ste
m
weight loss program and 92% of those surveyed would refer our program to others
.
S
tron
g
Brand Reco
g
nition. We believe that our brand is well reco
g
nized in the wei
g
ht mana
g
emen
t
i
n
d
ustry. Our company an
d
our pre
d
ecessors
h
ave
b
een
i
nt
h
ewe
i
g
h
t management
i
n
d
ustry
f
or more t
h
an 30
y
ears, an
d
we est
i
mate t
h
at our compan
y
an
d
our pre
d
ecessors
h
ave spent
h
un
d
re
d
so
f
m
illi
ons o
fd
o
ll
ars
i
n
a
dvertisin
g
over that time period
.
Low Cost, Highly Scalable Mode
l
. Unlike traditional commercial wei
g
ht loss pro
g
rams, which primaril
y
sell throu
g
h franchisee and compan
y
-owned centers, in our direct channel we
g
enerate revenue throu
g
hth
e
i
nternet an
d
te
l
ep
h
one. Our met
h
o
d
o
fdi
str
ib
ut
i
on removes t
h
e
fi
xe
d
costs an
d
cap
i
ta
li
nvestment assoc
i
ate
d
w
i
t
h
d
iet centers. We also minimize fixed costs and ca
p
ital investments in food
p
rocurement and fulfillment: we
o
utsource the production of our food products to a number of vendors and we outsource approximatel
y
87% of
o
ur
f
u
lfill
ment operat
i
ons to a t
hi
r
d
-party prov
id
er
.
S
u
p
erior Consumer Value Pro
p
osition. Our goal is to offer our customers a complete weight management
program t
h
at
i
s conven
i
ent, pr
i
vate an
d
cost-e
ff
ect
i
ve. Our customers p
l
ace t
h
e
i
ror
d
ers t
h
roug
h
t
h
e
i
nternet or
o
ver the phone and have their food delivered directl
y
to their homes. This affords our customers the convenienc
e
a
nd anonymity that other diets which rely on weight-loss centers cannot ensure. Additionally, we provide ou
r
customers w
i
t
h
a mont
h
o
ff
oo
d
,
i
nc
l
u
di
ng
b
rea
kf
ast,
l
unc
h
,
di
nner an
dd
esserts, w
hi
c
h
removes t
h
e con
f
us
i
on o
f
readin
g
nutrition labels, measurin
g
portions or countin
g
calories, carboh
y
drates or points. At a cost of about $10
a
day for three meals and a snack, we believe our weight management program offers our customers significant
v
a
l
ue an
di
spr
i
ce
db
e
l
ow t
h
ose o
f
our compet
i
tors. In a
ddi
t
i
on, we
d
o not c
h
arge a mem
b
ers
hi
p
f
ee, w
h
erea
s
man
y
of our competitors char
g
e such a fee
.
O
ur Industry
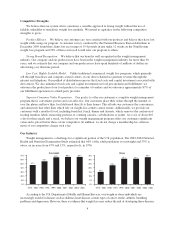
We
i
g
h
t management
i
sac
h
a
ll
enge
f
or a s
i
gn
ifi
cant port
i
on o
f
t
h
e U.S. popu
l
at
i
on. T
h
e 2003-2004 Nat
i
ona
l
H
ealth and Nutrition Examination Stud
y
estimated that
66
% of the adult population is overwei
g
ht and 33% is
o
bese, an increase from 47% and 1
5
%, respectivel
y
, in 1976:
1976 - 1980 1988 - 1994 1999 - 2000 2001 - 2002 2003 - 2004
0%
10%
20%
30%
40%
50%
60%
70%
47%
56%
65% 66% 66%
Overweight
5%
10%
15%
20%
25%
30%
35%
15%
23%
33%
31%31%
1976 - 1980 1988 - 1994 1999 - 2000 2001 - 2002 2003 - 2004
0%
Obese
A
ccor
di
ng to t
h
e U.S. Department o
f
Hea
l
t
h
an
d
Human Serv
i
ces, overwe
i
g
h
toro
b
ese
i
n
di
v
id
ua
l
sar
e
i
ncreas
i
n
gly
at r
i
s
kf
or
di
seases suc
h
as
di
a
b
etes,
h
eart
di
sease, certa
i
nt
y
pes o
f
cancer, stro
k
e, art
h
r
i
t
i
s,
b
reat
hi
n
g
problems and depression. However, there is evidence that wei
g
ht loss ma
y
reduce the risk of developin
g
these diseases
.
4