Nikon 2013 Annual Report Download - page 7
Download and view the complete annual report
Please find page 7 of the 2013 Nikon annual report below. You can navigate through the pages in the report by either clicking on the pages listed below, or by using the keyword search tool below to find specific information within the annual report.-
 1
1 -
 2
2 -
 3
3 -
 4
4 -
 5
5 -
 6
6 -
 7
7 -
 8
8 -
 9
9 -
 10
10 -
 11
11 -
 12
12 -
 13
13 -
 14
14 -
 15
15 -
 16
16 -
 17
17 -
 18
18 -
19
-
20
-
21
-
22
-
23
-
24
-
25
-
26
-
27
-
28
-
29
-
30
-
31
-
32
-
33
-
34
-
35
-
36
-
37
-
38
-
39
-
40
-
41
-
42
-
43
-
44
-
45
-
46
-
47
-
48
-
49
-
50
-
51
-
52
-
53
-
54
-
55
-
56
-
57
-
58
-
59
-
60
-
61
-
62
-
63
-
64
-
65
-
66
-
67
-
68
 |
 |

5
NIKON CORPORATION A N N U A L R E P O R T 2 0 13
Millions of Yen
Thousands of U.S.
Dollars (Note 2)
2009 2010 2011 2012 2013 2013 2013 Highlights
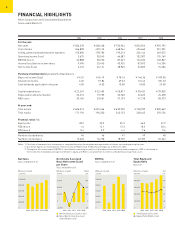
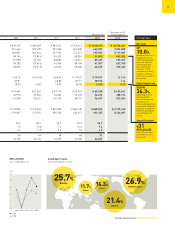
Net Sales
UP
10.0%
Revenue increase in
Imaging Products
contributed to gain,
with unit sales of
interchangeable
lens-type digital
cameras rising
amid deteriorating
market conditions
in the second half of
the period.
Operating Income
DOWN
36.3%
Operating income
was negatively
affected by market
contraction in
Precision Equipment,
and a deterioration in
earnings in Imaging
Products during the
second half of the
period.
Annual Dividend
¥31
PER SHARE
Down ¥7 per share
from the previous
fiscal year.
¥ 879,719 ¥ 785,499 ¥ 887,513 ¥ 918,652 ¥ 1,010,494 $ 10,744,221
561,642 552,409 575,536 567,000 663,509 7,054,858
269,892 246,944 257,924 271,571 295,983 3,147,081
48,185 (13,854) 54,053 80,081 51,002 542,282
81,095 22,102 88,087 112,651 87,227 927,457
39,180 (17,672) 46,506 86,168 61,857 657,700
28,056 (12,615) 27,313 59,306 42,459 451,452
¥ 70.76 ¥ (31.82) ¥ 68.90 ¥ 149.57 ¥ 107.07 $ 1.14
67.91 68.83 149.41 106.92 1.14
18.00 8.00 19.00 38.00 31.00 0.33
¥ 43,467 ¥ 37,525 ¥ 29,776 ¥ 55,915 ¥ 60,158 $ 639,641
32,910 35,956 34,034 32,570 36,226 385,174
61,489 60,261 60,767 68,701 76,497 813,364
¥ 749,805 ¥ 740,632 ¥ 829,909 ¥ 860,230 ¥ 865,020 $ 9,197,448
379,087 372,070 389,220 433,617 491,325 5,224,081
50.5 50.2 46.9 50.3 56.7
7.3 (3.4) 7.2 14.4 9.2
3.6 (1.7) 3.5 7.0 4.9
48 69 68 68 71
23,759 26,125 24,409 24,348 24,047
2009 2010 2011 2012 2013
12
8
4
0
-4
26.9%
United States
21.4%
Others
25.7%
Europe 11.7%
China
14.3%
Japan
(%)
16
ROE and ROA
Years ended March 31
Geographic Sales
Year ended March 31, 2013
ROE
ROA