Nikon 2004 Annual Report Download - page 3
Download and view the complete annual report
Please find page 3 of the 2004 Nikon annual report below. You can navigate through the pages in the report by either clicking on the pages listed below, or by using the keyword search tool below to find specific information within the annual report.-
 1
1 -
 2
2 -
 3
3 -
 4
4 -
 5
5 -
 6
6 -
 7
7 -
 8
8 -
 9
9 -
 10
10 -
 11
11 -
 12
12 -
 13
13 -
 14
14 -
15
-
16
-
17
-
18
-
19
-
20
-
21
-
22
-
23
-
24
-
25
-
26
-
27
-
28
-
29
-
30
-
31
-
32
-
33
-
34
-
35
-
36
-
37
-
38
-
39
-
40
-
41
-
42
-
43
-
44
-
45
-
46
 |
 |

( 6 ,0 0 4 )
( 8 ,14 3 )
20,911
7,770
2, 410
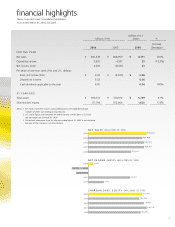
NikonCorporationandConsolidatedSubsidiaries
YearsendedMarch31,2004and2003
financialhighlights
171,194
N E T S A L E S ( M I L L I O N S O F Y EN )
N E T I N C O M E ( L O S S ) ( M I L L I O N S O F Y E N )
S H A R E H O L D E R S ’ E Q U I T Y ( M I L L I O N S O F Y EN )
162,46 4
176,961
186,119
166,495
20 04
20 03
20 02
20 01
20 00
20 04
20 03
20 02
20 01
20 00
20 04
20 03
20 02
20 01
20 00
468,959
482,975
483,957
371, 8 01
506,378
forward-lookingstatements
Statementscontainedinthisreportregardingtheplans,projectionsandstrategiesoftheNikonCorporationandits
subsidiariesandaffiliatesthatcomprisetheNikonGroup(hereinafter“Nikon”)thatarenothistoricalfactconstitutefor-
ward-lookingstatementsaboutfuturefinancialresults.Assuch,theyarebasedondatathatareobtainableatthetime
ofannouncementincompliancewithNikon’smanagementpoliciesandcertainpremisesthataredeemedreasonable
byNikon.Hence,actualresultsmaydiffer,insomecasessignificantly,fromtheseforward-lookingstatementsdueto
changesinvariousfactors,including—butnotlimitedto—economicconditionsinprincipalmarkets,productandservice
demandtrends,customercapitalinvestmenttrends,andcurrencyexchangeratefluctuations.
MillionsofYen
MillionsofU.S.
Dollars %
2004 2003 2004
Increase
(Decrease)
F OR T H E YE A R
Netsales ¥ 506,378 ¥ 468,959 $ 4,791 8.0%
Operatingincome 3,675 4,187 35 (12.2%)
Netincome(loss) 2,410 (8,143)23
Pershareofcommonstock(YenandU.S.dollars):
Basicnetincome(loss) ¥ 6.52 ¥ (22.03) $ 0.06
Dilutednetincome 6.02 0.06
Cashdividendsapplicabletotheyear 4.00 0.04 100%
AT Y E A R - EN D
Totalassets ¥ 606,513 ¥ 576,912 $ 5,739 5.1%
Shareholders’equity 171,194 162,464 1,620 5.4%
Notes:1.Pershareofcommonstockiscomputedbasedontheweightedaverage
numberofsharesoutstandingduringtheyear.
2.U.S.dollarfiguresaretranslatedforreferenceonlyat¥105.69toU.S.$1.00,
theexchangerateatMarch31,2004.
3.DilutednetincomepersharefortheyearendedMarch31,2003isnotdisclosed
becauseoftheCompany’snetlossposition.
1