Nikon 2004 Annual Report Download - page 19
Download and view the complete annual report
Please find page 19 of the 2004 Nikon annual report below. You can navigate through the pages in the report by either clicking on the pages listed below, or by using the keyword search tool below to find specific information within the annual report.-
 1
1 -
2
-
3
-
4
-
5
-
6
-
7
-
8
-
 9
9 -
 10
10 -
 11
11 -
 12
12 -
 13
13 -
 14
14 -
 15
15 -
 16
16 -
 17
17 -
 18
18 -
 19
19 -
 20
20 -
 21
21 -
 22
22 -
 23
23 -
 24
24 -
 25
25 -
 26
26 -
 27
27 -
 28
28 -
 29
29 -
30
-
31
-
32
-
33
-
34
-
35
-
36
-
37
-
38
-
39
-
40
-
41
-
42
-
43
-
44
-
45
-
46
 |
 |

17
For the year
Net sales
Cost of sales
SG&A expenses
Operating income
Income (loss) before income taxes and minority interest
Net income (loss)
Per share of common stock (Yen and U.S. dollars):
Basic net income (loss)
Diluted net income
Cash dividends applicable to the year
Capital expenditures
Depreciation and amortization
R&D costs
At year-end
Total assets
Shareholders’ equity
Notes: 1. Per share of common stock is computed based on the weighted average number of shares outstanding during the year.
2. U.S. dollar figures are translated for reference only at ¥105.69 to U.S. $1.00, the exchange rate at March 31, 2004.
3. Diluted net income per share for the year ended March 31, 2003 and 2002 is not disclosed because of the Company's net loss position.
Diluted net income per share for the year ended March 31, 2001 and 2000 is not disclosed because it was anti-dilutive.
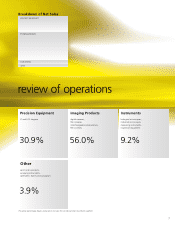
OPERATING ENVIRONMENT
In the fiscal year ended March 31, 2004, upward momentum in the market for semiconductors spurred gradual revitalization in capital
investment, while the digital camera market continued to expand.
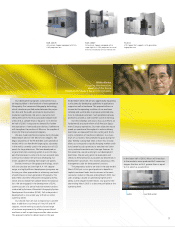
With regard to Nikon Group business segments, basic recovery in the semiconductor market drove new product launches and increased
sales of existing products in Precision Equipment. Brisk business was also seen in Imaging Products as expansion in the digital camera market
prompted the introduction of new products. In contrast, the ongoing downturn in the semiconductor market in the United States had
a negative impact on sales in Instruments, where harsh business conditions continued to prevail.
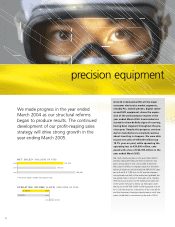
Precision Equipment
Share of net sales
Imaging Products
Share of net sales
Instruments
Share of net sales
Other
Share of net sales
Total
(Elimination)
Consolidated
Net Sales by Industry Segment
Years ended March 31, 2004 and 2003
Thousands of
U.S. Dollars
2004
$4,791,163
3,282,220
1,474,172
34,771
89,787
22,802
$0.06
0.06
0.04
$210,681
191,249
285,413
$5,738,605
1,619,776
2000
¥371,801
247,473
105,894
18,434
11,479
7,770
¥21.01
5.00
¥13,881
17,251
17,798
¥502,175
166,495
2001
¥483,957
301,759
120,775
61,423
29,827
20,911
¥56.53
8.00
¥25,996
16,007
22,794
¥593,454
186,119
2002
¥482,975
306,793
153,943
22,239
2,755
(6,004)
¥(16.23)
4.00
¥33,546
17,917
27,313
¥561,276
176,961
2003
¥468,959
307,503
157,269
4,187
(11,128)
(8,143)
¥(22.03)
¥20,226
20,435
27,506
¥576,912
162,464
2004
¥506,378
346,898
155,805
3,675
9,490
2,410
¥6.52
6.02
4.00
¥22,267
20,213
30,165
¥606,513
171,194
Millions of Yen
Thousands of
U.S. Dollars
2004
$1,495,449
2,693,845
454,087
375,091
$5,018,472
(227,309)
$4,791,163
2003
¥133,102
28.4%
271,956
58.0
49,872
10.6
41,875
8.9
¥496,805
(27,846)
(5.9)
¥468,959
2004
¥158,054
31.2%
284,713
56.2
47,992
9.5
39,643
7.8
¥530,402
(24,024)
(4.7)
¥506,378
Millions of Yen, %
five-year summary
NIKON CORPORATION AND CONSOLIDATED SUBSIDIARIES
YEARS ENDED MARCH 31
management’s discussion and analysis of operations