Nikon 2000 Annual Report Download - page 13
Download and view the complete annual report
Please find page 13 of the 2000 Nikon annual report below. You can navigate through the pages in the report by either clicking on the pages listed below, or by using the keyword search tool below to find specific information within the annual report.-
 1
1 -
2
-
 3
3 -
 4
4 -
 5
5 -
 6
6 -
 7
7 -
 8
8 -
 9
9 -
 10
10 -
 11
11 -
 12
12 -
 13
13 -
 14
14 -
 15
15 -
 16
16 -
 17
17 -
 18
18 -
 19
19 -
 20
20 -
 21
21 -
 22
22 -
 23
23 -
24
-
25
-
26
-
27
-
28
-
29
-
30
-
31
-
32
-
33
-
34
 |
 |

11
FINANCIAL REVIEW AND ANALYSIS
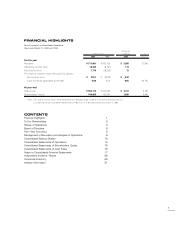
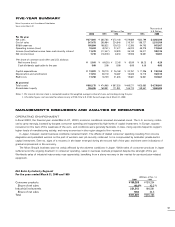
At fiscal year-end, total assets amounted to ¥502.2 billion, up ¥27.2 billion, or 5.7%, from the previous fiscal year-end. This was pri-
marily due to a rise in accounts receivable caused by a sharp increase in sales of industrial instruments towards the end of the year.
As a result, current assets increased by 7.8%, or ¥23.9 billion.
On the liabilities side, while accounts payable rose sharply as a consequence of heightened production levels arising from increased
sales, a slight drop in borrowings resulted in total liabilities increasing by just ¥21.7 billion.
Dividends paid in fiscal 2000 amounted to ¥2.0 billion. Although an increase in the number of consolidated subsidiaries caused
retained earnings to fall by ¥0.2 billion, the return to profitability at the net income level boosted shareholders’ equity by ¥7.8 billion. In
net terms, total shareholders’ equity increased by ¥5.5 billion.
Cash and cash equivalents at the year-end amounted to ¥32.6 billion. As a result of the various measures taken to boost earn-
ings, to reform management structures and to strengthen Nikon’s development, production and sales functions, net income for the
year before income taxes and minority interest recovered from the previous year’s loss to a relative high of ¥11.5 billion.
In terms of cash flows, net cash provided by operating activities increased by ¥15.4 billion to ¥37.5 billion, while net cash used in
investing activities fell from ¥23.5 billion to ¥4.4 billion. As a result of a net reduction in the issuance of commercial paper, net cash
used in financing activities amounted to ¥22.8 billion, compared with ¥5.5 billion provided by financing activities in the previous year. As
a result, after accounting for a ¥1.1 billion decrease due to the effect of exchange rate changes, cash and cash equivalents rose ¥9.2
billion over the previous year.
2000 17.8
R&D Expenditures
(¥Billion)
1999 18.7
1998 21.6
1997 19.7
1996 17.0
2000 166.5
Shareholders' Equity
(¥Billion)
1999 161.0
1998 171.1
1997 165.8
1996 148.7
2000 4.7
Return on Equity (%)
1999 (11.0)
1998 4.9
1997 12.7
1996 13.2
2000 371.8
Net Sales
(¥Billion)
1999 305.8
1998 372.1
1997 379.1
1996 332.8
2000 18.4
Operating Income (Loss)
(¥Billion)
1999 (8.7)
1998 27.5
1997 46.9
1996 49.3
2000 7.8
Net Income (Loss)
(¥Billion)
1999 (18.2)
1998 8.3
1997 19.9
1996 18.6
2000 21.0
Net Income (Loss)
per Share (¥)
1999 (49.3)
1998 22.5
1997 53.9
1996 50.2
2000 13.9
Capital Expenditures
(¥Billion)
1999 20.7
1998 26.2
1997 33.8
1996 17.2