Nikon 2000 Annual Report Download - page 12
Download and view the complete annual report
Please find page 12 of the 2000 Nikon annual report below. You can navigate through the pages in the report by either clicking on the pages listed below, or by using the keyword search tool below to find specific information within the annual report.-
 1
1 -
 2
2 -
 3
3 -
 4
4 -
 5
5 -
 6
6 -
 7
7 -
 8
8 -
 9
9 -
 10
10 -
 11
11 -
 12
12 -
 13
13 -
 14
14 -
 15
15 -
 16
16 -
 17
17 -
 18
18 -
 19
19 -
 20
20 -
 21
21 -
 22
22 -
23
-
24
-
25
-
26
-
27
-
28
-
29
-
30
-
31
-
32
-
33
-
34
 |
 |

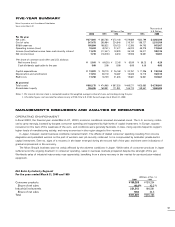
OPERATIONAL REVIEW AND ANALYSIS
Nikon implemented a number of initiatives during the year designed to boost consolidated earnings. The introduction of an in-house
company system made individual firms within the Nikon Group more accountable for financial performance by delegating management
responsibilities. The company’s surveying instruments operations-development, production and sales functions-were unified and incorpo-
rated as a separate company. In addition, the ophthalmic lens business was merged into an international joint venture to aid its expan-
sion and development. Nikon developed and launched a number of new products designed to appeal to market trends. Resources were
also reallocated to shift management focus to prioritized areas.
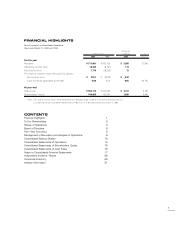
Net consolidated sales in fiscal 2000 rose 21.6%, or ¥66.0 billion, to ¥371.8 billion. Net income recovered from a loss in fiscal
1999 to reach ¥7.8 billion.
In terms of performance by industry segment, net sales of consumer products increased 8.0% to ¥150.3 billion, largely as a
result of buoyant sales of digital cameras. Operating income rose sharply, to ¥8.9 billion. With sales of steppers recovering strongly,
consolidated net sales of industrial instruments rose 33.0% to ¥221.5 billion, producing operating income of ¥9.5 billion.
Splitting out the performance by region, sales in Japan were boosted by a swift recovery in the market for semiconductor-related
equipment. Domestic revenues surged 21.4% to ¥333.3 billion, producing operating income of ¥9.4 billion. Overseas, sales of con-
sumer products-especially digital cameras-and steppers and other industrial equipment advanced both in the United States and in
Europe. Sales in the United States rose 20.3% to ¥97.0 billion, resulting in operating income of ¥6.0 billion. Sales in Europe soared
35.1% to ¥49.0 billion, leading to operating income of ¥0.3 billion. In Asia, principally due to continued price erosion in the consumer
products sector, sales dipped 4.2% to ¥10.9 billion, producing operating income of ¥1.6 billion.
10
Income Analysis
For the years ended March 31, 2000 and 1999
(% of Net Sales)
2000 1999
Net sales 100.0% 100.0 %
Cost of sales (66.6) (67.4)
Gross profit 33.4 32.6
SG&A expenses (28.5) (35.5)
Operating income (loss) 4.9 (2.9)
Net interest expense and dividend income (1.1) (1.4)
Net other income (expenses) (0.7) (1.4)
Income (loss) before income taxes and minority interest 3.1 (5.7)
Income taxes (1.0) (0.3)
Minority interest (0.0) 0.0
Net income (loss) 2.1 (6.0)
Note: All expenses and subtractive amounts are in parentheses.
Balance Sheet Analysis
At March 31, 2000 and 1999
(% of Total Assets)
2000 1999
Total assets 100.0% 100.0%
Total current assets 66.2 65.0
Inventories 30.6 31.7
Property, plant and equipment 17.8 21.4
Investments and other assets 16.0 13.6
Total current liabilities 47.4 44.1
Short-term borrowings 17.0 22.5
Long-term debt, less current portion 19.1 21.7
Shareholders’ equity 33.2 33.9