Nikon 2000 Annual Report Download - page 11
Download and view the complete annual report
Please find page 11 of the 2000 Nikon annual report below. You can navigate through the pages in the report by either clicking on the pages listed below, or by using the keyword search tool below to find specific information within the annual report.-
 1
1 -
 2
2 -
 3
3 -
 4
4 -
 5
5 -
 6
6 -
 7
7 -
 8
8 -
 9
9 -
 10
10 -
 11
11 -
 12
12 -
 13
13 -
 14
14 -
 15
15 -
 16
16 -
 17
17 -
 18
18 -
 19
19 -
 20
20 -
 21
21 -
 22
22 -
23
-
24
-
25
-
26
-
27
-
28
-
29
-
30
-
31
-
32
-
33
-
34
 |
 |

9
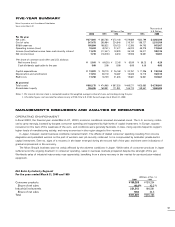
OPERATING ENVIRONMENT
In fiscal 2000, the financial year ended March 31, 2000, economic conditions remained somewhat mixed. The U.S. economy contin-
ued to grow strongly, boosted by buoyant consumer spending and supported by high levels of capital investment. In Europe, exports
recovered on the back of the weakness of the euro, and conditions were generally favorable. In Asia, rising exports helped to support
higher levels of manufacturing activity, and many economies in the region staged a firm recovery.
In Japan, however, overall business conditions remained harsh. The effects of stalled consumer spending resulting from income
stagnation and persistent worries on the part of workers over job security continued to be compounded by lackluster private-sector
capital investment. Even so, signs of a recovery in the latter emerged during the second half of the year, and there were indications of
gradual improvement in the economy.
The Nikon Group’s business was not unduly affected by the adverse conditions in Japan. While sales of consumer products in Japan
suffered amid the ongoing downturn in consumer spending, sales in overseas markets prospered despite the strength of the yen.
Worldwide sales of industrial instruments rose appreciably, benefiting from a sharp recovery in the market for semiconductor-related
equipment.
Net Sales by Industry Segment
For the years ended March 31, 2000 and 1999
(Millions of Yen, %)
2000 1999
Consumer products ¥150,288 ¥139,204
Share of net sales 40.4 % 45.5 %
Industrial instruments 221,513 166,561
Share of net sales 59.6 54.5
Total ¥371,801 ¥305,765
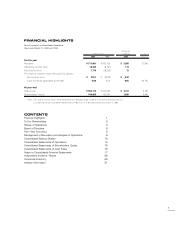
Thousands of
Millions of Yen U.S. Dollars
2000 1999 1998 1997 1996 2000
For the year
Net sales ¥ 371,801 ¥ 305,765 ¥ 372,146 ¥ 379,089 ¥332,799 $ 3,502,599
Cost of sales 247,473 205,984 224,546 219,791 188,727 2,331,350
SG&A expenses 105,894 108,522 120,123 112,385 94,793 997,587
Operating income (loss) 18,434 (8,741 ) 27,477 46,913 49,279 173,662
Income (loss) before income taxes and minority interest 11,479 (17,447 ) 18,929 36,740 35,317 108,136
Net income (loss) 7,770 (18,233 ) 8,318 19,936 18,581 73,201
Per share of common stock (Yen and U.S. dollars):
Net income (loss) ¥ 21.01 ¥ (49.29 ) ¥ 22.48 ¥ 53.89 ¥ 50.23 $ 0.20
Cash dividends applicable to the year 5.00 3.00 8.00 8.00 6.50 0.05
Capital expenditures ¥ 13,881 ¥ 20,719 ¥ 26,168 ¥ 33,757 ¥ 17,206 $ 130,769
Depreciation and amortization 17,251 20,110 18,407 15,635 13,715 162,515
R&D costs 17,798 18,729 21,633 19,681 16,951 167,667
At year-end
Total assets ¥ 502,175 ¥ 474,965 ¥ 507,326 ¥ 460,271 ¥425,083 $ 4,730,801
Shareholders' equity 166,495 160,991 171,051 165,773 148,657 1,568,485
Notes: 1. Per share of common stock is computed based on the weighted average number of shares outstanding during the year.
2. U.S. dollar figures are translated for reference only at ¥106.15 to U.S. $1.00, the exchange rate at March 31, 2000.
FIVE-YEAR SUMMARY
MANAGEMENT’S DISCUSSION AND ANALYSIS OF OPERATIONS
Nikon Corporation and Consolidated Subsidiaries
Years ended March 31