National Grid 2006 Annual Report Download - page 25
Download and view the complete annual report
Please find page 25 of the 2006 National Grid annual report below. You can navigate through the pages in the report by either clicking on the pages listed below, or by using the keyword search tool below to find specific information within the annual report.-
 1
1 -
2
-
3
-
4
-
5
-
6
-
7
-
8
-
9
-
10
-
11
-
12
-
13
-
14
-
 15
15 -
 16
16 -
 17
17 -
 18
18 -
 19
19 -
 20
20 -
 21
21 -
 22
22 -
 23
23 -
 24
24 -
 25
25 -
 26
26 -
 27
27 -
 28
28 -
 29
29 -
 30
30 -
 31
31 -
 32
32 -
 33
33 -
 34
34 -
 35
35 -
36
-
37
-
38
-
39
-
40
-
41
-
42
-
43
-
44
-
45
-
46
-
47
-
48
-
49
-
50
-
51
-
52
-
53
-
54
-
55
-
56
-
57
-
58
-
59
-
60
-
61
-
62
-
63
-
64
-
65
-
66
-
67
 |
 |

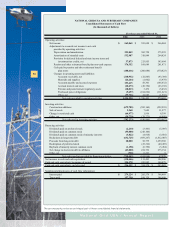
LIQUIDITY AND CAPITAL RESOURCES
SHORT TERM
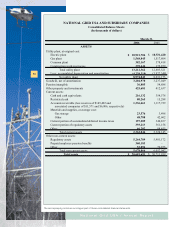
At March 31, 2006, the Company’s principal sources of liquidity included cash and cash equiva-
lents of approximately $216 million and accounts receivable of approximately $1.3 billion. The
Company has a negative working capital balance of $43 million. Cash is being generated from
sales (via electric rates) to offset stranded cost amortization (non-cash expense). This excess cash
is used for debt payments and other operating needs. As discussed below, the Company believes
it has sufficient cash flow and borrowing capacity to fund such deficits as necessary in the near
term. In addition, construction expenditures planned within one year are estimated to be $711 mil-
lion.
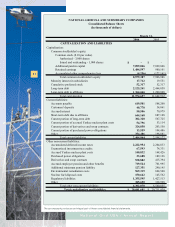
Operating Activities
Net cash provided by operating activities decreased $2 million for the fiscal year ended March 31,
2006 from the prior fiscal year. The decrease is primarily due to the following:
■Reduction in provision for deferred income taxes of $176 million primarily due to the expiration
in December 2004 of federal bonus depreciation.
■Increased accounts receivable of $186 million primarily due to the higher costs of electricity
and gas passed along to customers.
■Increased materials and supplies of $25 million primarily due to the higher cost of stored gas
and the lower volume of gas sold relative to the prior fiscal year because of milder winter tem-
peratures.
These were offset by:
■Increased depreciation and amortization of $11 million due to capital projects, including new
information technology systems, going into service.
■Increased stranded cost recovery of $214 million due to (i) the resumption of the USGen
agreements and (ii) in accordance with Niagara Mohawk’s merger rate plan.
■Decrease in purchase power obligations payments of $95 million due to the resumption of the
USGen agreements.
■Increased accounts payable and accrued expenses and an increase in accrued interest and
taxes of $143 million primarily due to an increase in accrued taxes of $127 million.
Investing Activities
Net cash used in investing activities increased approximately $171 million in the current fiscal year.
This increase was primarily due to an increase in construction additions and an increase in restrict-
ed cash. Capital expenditures increased approximately $88 million during fiscal year 2006 primarily
due to increased transmission utility plant expenditures at NEP. The funds necessary for utility
plant expenditures during the period were primarily provided by internal funds. Restricted cash
increased $67 million primarily due to equity in hedge accounts related to the rise in underlying
commodity prices.
Financing Activities
Net cash used in financing activities increased approximately $76 million for the fiscal year ended
March 31, 2006 from the prior fiscal year. The primary reasons for the increase are:
■Increased reduction in short-term debt to affiliates of $278 million. In the prior fiscal years pre-
sented, the change in short-term debt to affiliates represented cash inflows.
■Decrease in dividends paid on common stock of $163 million.
■Decrease in the reduction of long term debt of $37 million.
25
National Grid USA / Annual Report