National Grid 2006 Annual Report Download - page 16
Download and view the complete annual report
Please find page 16 of the 2006 National Grid annual report below. You can navigate through the pages in the report by either clicking on the pages listed below, or by using the keyword search tool below to find specific information within the annual report.-
 1
1 -
2
-
3
-
4
-
5
-
 6
6 -
 7
7 -
 8
8 -
 9
9 -
 10
10 -
 11
11 -
 12
12 -
 13
13 -
 14
14 -
 15
15 -
 16
16 -
 17
17 -
 18
18 -
 19
19 -
 20
20 -
 21
21 -
 22
22 -
 23
23 -
 24
24 -
 25
25 -
 26
26 -
27
-
28
-
29
-
30
-
31
-
32
-
33
-
34
-
35
-
36
-
37
-
38
-
39
-
40
-
41
-
42
-
43
-
44
-
45
-
46
-
47
-
48
-
49
-
50
-
51
-
52
-
53
-
54
-
55
-
56
-
57
-
58
-
59
-
60
-
61
-
62
-
63
-
64
-
65
-
66
-
67
 |
 |

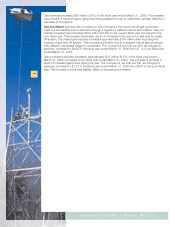
■Other revenue consists of transmission wheeling revenue (revenue generated from transmitting
electricity of other utilities over Company-owned transmission lines) and miscellaneous ancil-
lary revenues. The increase of $244 million for the fiscal year ended March 31, 2006 from the
prior fiscal year is due to (i) a $196 million increase in NEP’s CTC deferral revenues due to the
application of the proceeds received under the USGen settlement, (ii) a $32 million adjustment
in Niagara Mohawk’s electric revenue related to the recognition of a regulatory asset reflecting
the Company’s ability to recover a previously fully reserved accounts receivable, and (iii) other
changes of $16 million.
Electricity purchased increased approximately $633 million (22%) for the fiscal year ended March
31, 2006 relative to the prior fiscal year. These costs represent the Company’s cost to procure
electricity for its customers who have not chosen an alternative energy supplier. The increase is
primarily due to an increase in the price of electricity relative to the prior fiscal year. The increase is
also attributable to the resumption of the obligation of certain long-term purchased power con-
tracts that had been assumed by USGen when NEP had divested its generation assets in 1998.
USGen declared bankruptcy and on April 1, 2005, the ongoing obligation of these contracts
reverted back to NEP. These costs do not impact electric margin or net income as the Company’s
applicable tariffs and rate plans allow full recovery of these costs from customers.
Electricity purchased decreased approximately $234 million (7%) in the fiscal year ended March
31, 2005. The decrease in expense primarily related to New York and was the result of a 5.5 bil-
lion (17%) decrease in the volume of kWh purchased due to customers migrating to competitive
electricity suppliers and less extreme weather in the current year.
GAS
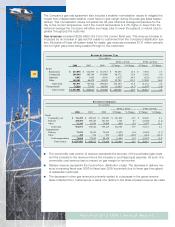
Niagara Mohawk is also a gas distribution company that services customers in cities and towns in
central and eastern New York. Niagara Mohawk’s gas rate plan allows it to recover all commodity
costs (i.e., the purchasing, interstate transportation and storage of gas for sale to customers) from
customers (similar to the recoverability of purchased electricity).
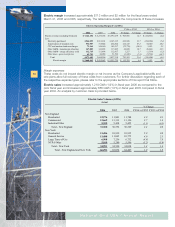
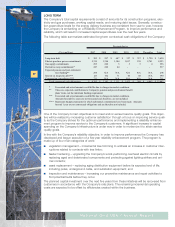
Gas margin decreased approximately $1.6 million (0.6 %) in the fiscal year ended March 31, 2006
and decreased approximately $4.6 million (1.5 %) in the fiscal year ended March 31, 2005. The
table below details the components of these changes.
The $1.6 million decrease in gas margin comparing fiscal year 2006 to fiscal year 2005 is primarily
due to a decline in margin from residential customers as a result of a decline in weather normal-
ized use per customer. The decline in weather normalized use per customer is primarily due to
customer conservation due to rising gas prices.
The $4.6 million decrease in gas margin after a one-time item comparing fiscal year 2005 to
fiscal year 2004 is primarily due to the elimination of the $6 million state income tax adjustment
recorded in the prior period, partially offset by an increase in gas margin of $1.4 million. The
state income tax adjustment is a non-cash item included in revenue (with the offsetting expense
included in income taxes). In fiscal year 2003, approximately $10 million was accrued in revenue
as estimated state income tax expense (as state income taxes are recoverable through the
Company’s rate agreement). In fiscal year 2004, when the state income taxes were reconciled
and paid it was determined that the Company over-accrued its income tax liability by approxi-
mately $6 million and the Company subsequently reversed the over-accrual.
16
National Grid USA / Annual Report
2006 2005 2004 $ Change % Change $ Change % Change
Gas revenue 1,037,081$ 808,015$ 779,600$ 229,066$ 28.3 28,415$ 3.6
Less:
Gas purchased 741,419 509,543 478,647 231,876 45.5 30,896 6.5
Other taxes - gross receipts tax 8,049 9,236 13,123 (1,187) (12.9) (3,887) (29.6)
Gas margin 287,613 289,236 287,830 (1,623) (0.6) 1,406 0.5
Gas revenue - state income tax adjustment - - (5,957) - - 5,957 (100.0)
Gas margin after one-time item 287,613$ 289,236$ 293,787$ (1,623)$ (0.6) (4,551)$ (1.5)
FY05 vs FY04
Gas Operating Margin ($'s in 000's)
FY06 vs FY05