National Grid 2006 Annual Report Download - page 12
Download and view the complete annual report
Please find page 12 of the 2006 National Grid annual report below. You can navigate through the pages in the report by either clicking on the pages listed below, or by using the keyword search tool below to find specific information within the annual report.-
 1
1 -
 2
2 -
 3
3 -
 4
4 -
 5
5 -
 6
6 -
 7
7 -
 8
8 -
 9
9 -
 10
10 -
 11
11 -
 12
12 -
 13
13 -
 14
14 -
 15
15 -
 16
16 -
 17
17 -
 18
18 -
 19
19 -
 20
20 -
 21
21 -
 22
22 -
23
-
24
-
25
-
26
-
27
-
28
-
29
-
30
-
31
-
32
-
33
-
34
-
35
-
36
-
37
-
38
-
39
-
40
-
41
-
42
-
43
-
44
-
45
-
46
-
47
-
48
-
49
-
50
-
51
-
52
-
53
-
54
-
55
-
56
-
57
-
58
-
59
-
60
-
61
-
62
-
63
-
64
-
65
-
66
-
67
 |
 |

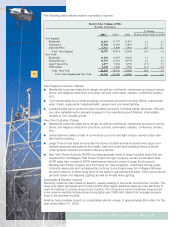
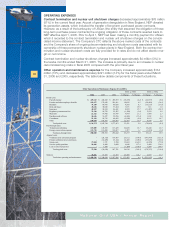
RESULTS OF OPERATIONS
The following discussion and analysis highlights items that significantly affected the Company’s
operations during the fiscal years ended March 31, 2006 and 2005.
EARNINGS
Net income for the fiscal year ended March 31, 2006 increased approximately $8 million (2%) as
compared to the prior fiscal year and increased approximately $288 million (108%) for the fiscal
year ended March 31, 2005 as compared to the prior fiscal year. The increases are primarily due
to the following:
For further discussion regarding each of the respective amounts identified above, please refer to
the appropriate sections of this report that follow.
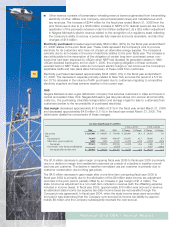
ELECTRIC
The Company’s electricity business encompasses the transmission, distribution, and delivery
of electricity including stranded cost recoveries. The Company’s distribution subsidiaries
(Massachusetts Electric, Narragansett Electric, Granite State Electric and Nantucket Electric) are
responsible for the distribution and sale of electricity to customers while NEP is responsible for the
transmission of electricity. Niagara Mohawk is responsible for the transmission, distribution, and
sale of electricity.
The Company is no longer in the business of electricity generation and has divested its formerly
owned generation assets (the Company still retains a nine percent joint ownership interest in the
Wyman #4 generating unit in Maine, which the Company is attempting to sell). Since deregulation,
electricity customers have the ability to choose an alternative supplier of their electricity other than
the retail distribution company serving that customer’s region. For customers who have not cho-
sen an alternative supplier, the Company procures power on their behalf. These energy procure-
ment costs (i.e., purchased electricity expenses) are recoverable from customers and do not
impact the Company’s electric margin or net income.
12
National Grid USA / Annual Report
Notes 2006 2005
Prior year net income 553,698$ 266,084$
Changes in:
Electric margin 112,783 1,953
Gas margin (1,623) 1,406
Other operation and maintenance (a) (87,757) 248,996
Depreciation and amortization (11,091) (6,763)
Other taxes (b) (6,251) 11,854
Income taxes (9,823) (36,562)
Other income and deductions (10,431) 26,760
Interest 19,522 38,530
Gridcom (c) 3,038 1,440
Total changes 8,367 287,614
Current year net income 562,065$ 553,698$
Notes to table:
(a) Amounts exclude Gridcom expenses and pass through items which are included
in the electric margin calculation.
(b) Amounts exclude gross receipts taxes which are included
in the electric and gas margin calculations.
(c) Amounts represent the change in revenue and operating expenses in the Company's
non-regulated telecommunications businesses.
Fiscal year ended March 31,