NEC 2012 Annual Report Download - page 4
Download and view the complete annual report
Please find page 4 of the 2012 NEC annual report below. You can navigate through the pages in the report by either clicking on the pages listed below, or by using the keyword search tool below to find specific information within the annual report.
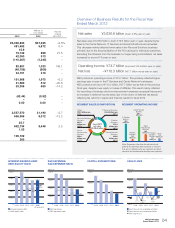
2008
25.0%
22.2%
19.9%
15.9%
15.4%
2009
4,617.2
2010
4,215.6
2011
3,583.1
3,115.4
3,036.8
2012
6,000.0
4,000.0
2,000.0
0
200.0
150.0
50.0
100.0
0
3.4%
–0.1%
1.4%
1.9%
156.8
–6.2
50.9 57.8
–50.0 2008 2009 2010 2011 2012
73.72.4%
0.5%
–7.0%
0.3%
–0.4%
22.7
–296.6
11.4
2008 2009 2010 2011 2012
–110.3
–3.6%
–300.0
0
10.0
20.0
30.0
–12.5
2008 2009 2010 2011 2012
0
400.0
800.0
1,200.0
28.5%
20.9%
26.9% 28.8%
1,004.2
641.7
790.9 757.1
25.7%
657.0
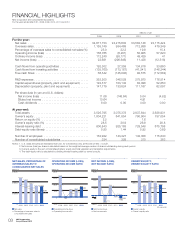
FINANCIAL HIGHLIGHTS
NEC Corporation and Consolidated Subsidiaries
For the years ended March 31, 2008, 2009, 2010, 2011 and 2012
Millions of yen
2008 2009 2010 2011
For the year:
Net sales . . . . . . . . . . . . . . . . . . . . . . . . . . . . . . . . . . . . . . ¥4,617,153 ¥4,215,603 ¥3,583,148 ¥3,115,424
Overseas sales . . . . . . . . . . . . . . . . . . . . . . . . . . . . . . . . . . 1,155,749 934,469 712,886 479,349
Percentage of overseas sales to consolidated net sales (%) 25.0 22.2 19.9 15.4
Operating income (loss) . . . . . . . . . . . . . . . . . . . . . . . . . . . 156,765 (6,201) 50,905 57,820
Ordinary income (loss) . . . . . . . . . . . . . . . . . . . . . . . . . . . . 112,240 (93,171) 49,429 41
Net income (loss) . . . . . . . . . . . . . . . . . . . . . . . . . . . . . . . . 22,681 (296,646) 11,428 (12,518)
Cash flows from operating activities . . . . . . . . . . . . . . . . . . 192,302 27,359 134,816 33,660
Cash flows from investing activities . . . . . . . . . . . . . . . . . . (135,760) (173,167) (41,241) (146,244)
Free cash flows . . . . . . . . . . . . . . . . . . . . . . . . . . . . . . . . . 56,542 (145,808) 93,575 (112,584)
R&D expenses . . . . . . . . . . . . . . . . . . . . . . . . . . . . . . . . . . 352,200 346,529 275,970 176,514
Capital expenditures (property, plant and equipment) . . . . . 122,577 103,142 83,098 52,850
Depreciation (property, plant and equipment) . . . . . . . . . . . 147,779 133,624 111,167 62,097
Per share data (in yen and U.S. dollars):
Net income (loss) . . . . . . . . . . . . . . . . . . . . . . . . . . . . . . 11.06 (146.64) 5.04 (4.82)
Diluted net income . . . . . . . . . . . . . . . . . . . . . . . . . . . . . 10.64 – 4.91 –
Cash dividends . . . . . . . . . . . . . . . . . . . . . . . . . . . . . . . . 8.00 0.00 4.00 0.00
At year-end:
Total assets . . . . . . . . . . . . . . . . . . . . . . . . . . . . . . . . . . . . 3,526,795 3,075,378 2,937,644 2,628,931
Owner’s equity . . . . . . . . . . . . . . . . . . . . . . . . . . . . . . . . . . 1,004,221 641,654 790,904 757,054
Return on equity (%) . . . . . . . . . . . . . . . . . . . . . . . . . . . . . 2.2 – 1.6 –
Owner’s equity ratio (%) . . . . . . . . . . . . . . . . . . . . . . . . . . . 28.5 20.9 26.9 28.8
Interest-bearing debt . . . . . . . . . . . . . . . . . . . . . . . . . . . . . 800,843 925,163 729,548 675,798
Debt-equity ratio (times) . . . . . . . . . . . . . . . . . . . . . . . . . . . 0.80 1.44 0.92 0.89
Number of employees . . . . . . . . . . . . . . . . . . . . . . . . . . . . 152,922 143,327 142,358 115,840
Number of consolidated subsidiaries . . . . . . . . . . . . . . . . . 334 328 310 283
Notes: 1. U.S. dollar amounts are translated from yen, for convenience only, at the rate of ¥82 = U.S.$1.
2. Net income (loss) per share is calculated based on the weighted-average number of shares outstanding during each period.
3. Owner’s equity is the sum of total shareholders’ equity and total valuation and translation adjustments.
4. The debt-equity ratio is calculated by dividing interest-bearing debt by owner’s equity.
Net sales
Percentage of overseas sales to
consolidated net sales
Net income (loss)
Net income ratio
OWNER’S EQUITY,
OWNER’S EQUITY RATIO
(Billion ¥)
Owner’s equity
Owner’s equity ratio
(At year-end)
Operating income (loss)
Operating income ratio
NET SALES, PERCENTAGE OF
OVERSEAS SALES TO
CONSOLIDATED NET SALES
(Billion ¥)
OPERATING INCOME (LOSS),
OPERATING INCOME RATIO
(Billion ¥)
NET INCOME (LOSS),
NET INCOME RATIO
(Billion ¥)
03 NEC Corporation
Annual Report 2012

