NEC 2010 Annual Report Download - page 5
Download and view the complete annual report
Please find page 5 of the 2010 NEC annual report below. You can navigate through the pages in the report by either clicking on the pages listed below, or by using the keyword search tool below to find specific information within the annual report.-
 1
1 -
 2
2 -
 3
3 -
 4
4 -
 5
5 -
 6
6 -
 7
7 -
 8
8 -
 9
9 -
 10
10 -
 11
11 -
 12
12 -
 13
13 -
 14
14 -
 15
15 -
 16
16 -
17
-
18
-
19
-
20
-
21
-
22
-
23
-
24
-
25
-
26
-
27
-
28
-
29
-
30
-
31
-
32
-
33
-
34
-
35
-
36
-
37
-
38
-
39
-
40
-
41
-
42
-
43
-
44
-
45
-
46
-
47
-
48
-
49
-
50
-
51
-
52
-
53
-
54
-
55
-
56
-
57
-
58
-
59
-
60
-
61
-
62
-
63
-
64
-
65
-
66
-
67
-
68
-
69
-
70
-
71
-
72
-
73
-
74
-
75
-
76
-
77
-
78
-
79
-
80
-
81
-
82
-
83
-
84
-
85
-
86
-
87
-
88
-
89
-
90
-
91
-
92
-
93
-
94
-
95
-
96
-
97
-
98
-
99
-
100
-
101
-
102
-
103
-
104
-
105
-
106
-
107
-
108
-
109
-
110
-
111
-
112
-
113
-
114
-
115
-
116
-
117
-
118
-
119
-
120
-
121
-
122
-
123
-
124
-
125
-
126
-
127
-
128
-
129
-
130
-
131
-
132
 |
 |

4,000
3,000
2,000
1,000
0
5,000
08 09 10
500
0
1,000
1,500
08 09 10
10
0
–300
20
30
08 09 10
50
100
–50
0
150
200
08 09 10 –1.0
0.0
1.0
2.0
3.0
4.0
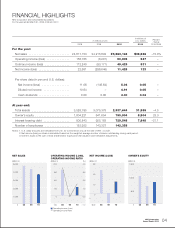
NET SALES
(Billion ¥)
OPERATING INCOME (LOSS),
OPERATING INCOME RATIO
(Billion ¥) (%)
NET INCOME (LOSS)
(Billion ¥)
OWNER’S EQUITY
(Billion ¥)
FINANCIAL HIGHLIGHTS
NEC Corporation and Consolidated Subsidiaries
For the years ended March 31, 2008, 2009 and 2010
In millions of yen
In millions of
U.S. dollars Percent
change
2010/20092008 2009 2010 2010
For the year:
Net sales . . . . . . . . . . . . . . . . . . . . . . . . . ¥4,617,153 ¥4,215,603 ¥3,583,148 $38,528 –15.0%
Operating income (loss) . . . . . . . . . . . . . . 156,765 (6,201) 50,905 547 –
Ordinary income (loss) . . . . . . . . . . . . . . . 112,240 (93,171) 49,429 531 –
Net income (loss) . . . . . . . . . . . . . . . . . . . 22,681 (296,646) 11,428 123 –
Per share data (in yen and U.S. dollars):
Net income (loss) . . . . . . . . . . . . . . . . . 11.06 (146.64) 5.04 0.05 –
Diluted net income . . . . . . . . . . . . . . . . 10.64 –4.91 0.05 –
Cash dividends . . . . . . . . . . . . . . . . . . . 8.00 0.00 4.00 0.04 –
At year-end:
Total assets . . . . . . . . . . . . . . . . . . . . . . . 3,526,795 3,075,378 2,937,644 31,588 –4.5
Owner’s equity . . . . . . . . . . . . . . . . . . . . . 1,004,221 641,654 790,904 8,504 23.3
Interest-bearing debt . . . . . . . . . . . . . . . . 800,843 925,163 729,548 7,845 –21.1
Number of employees . . . . . . . . . . . . . . . 152,922 143,327 142,358
Notes: 1. U.S. dollar amounts are translated from yen, for convenience only, at the rate of ¥93 = U.S.$1.
2. Net income (loss) per share is calculated based on the weighted-average number of shares outstanding during each period.
3. Owner’s equity is the sum of total shareholders’ equity and total valuation and translation adjustments.
Operating Income (Loss)
Operating Income Ratio
04
NEC Corporation
Annual Report 2010