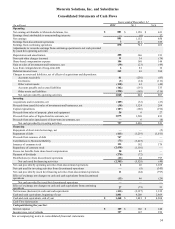
Motorola 2012 Annual Report Download - page 69
Download and view the complete annual report
Please find page 69 of the 2012 Motorola annual report below. You can navigate through the pages in the report by either clicking on the pages listed below, or by using the keyword search tool below to find specific information within the annual report.-
 1
1 -
2
-
3
-
4
-
5
-
6
-
7
-
8
-
9
-
10
-
11
-
12
-
13
-
14
-
15
-
16
-
17
-
18
-
19
-
20
-
21
-
22
-
23
-
24
-
25
-
26
-
27
-
28
-
29
-
30
-
31
-
32
-
33
-
34
-
35
-
36
-
37
-
38
-
39
-
40
-
41
-
42
-
43
-
44
-
45
-
46
-
47
-
48
-
49
-
50
-
51
-
52
-
53
-
54
-
55
-
56
-
57
-
58
-
 59
59 -
 60
60 -
 61
61 -
 62
62 -
 63
63 -
 64
64 -
 65
65 -
 66
66 -
 67
67 -
 68
68 -
 69
69 -
 70
70 -
 71
71 -
 72
72 -
 73
73 -
 74
74 -
 75
75 -
 76
76 -
 77
77 -
 78
78 -
 79
79 -
80
-
81
-
82
-
83
-
84
-
85
-
86
-
87
-
88
-
89
-
90
-
91
-
92
-
93
-
94
-
95
-
96
-
97
-
98
-
99
-
100
-
101
-
102
-
103
-
104
-
105
-
106
-
107
-
108
-
109
-
110
-
111
-
112
-
113
-
114
-
115
-
116
-
117
-
118
-
119
-
120
 |
 |

61
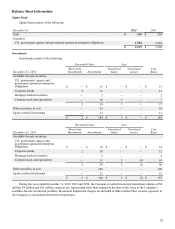
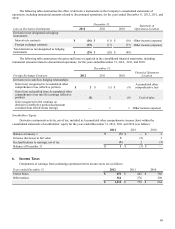
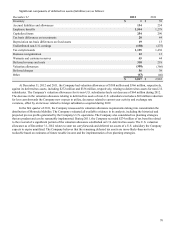
Other Income (Expense)
Interest expense, net, and Other both included in Other income (expense) consist of the following:
Years ended December 31 2012 2011 2010
Interest expense, net:
Interest expense $(108)$(132)$ (217)
Interest income 42 58 88
$(66)$(74)$ (129)
Other:
Investment impairments $(8)$(4)$ (21)
Loss from the extinguishment of the Company’s outstanding long-term
debt (6)(81)(12)
Foreign currency gain (loss) (13)812
Gain on Sigma Fund investments ——11
Other 13 83
$(14)$(69)$ (7)
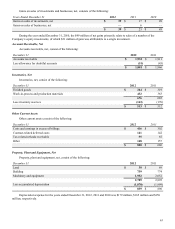
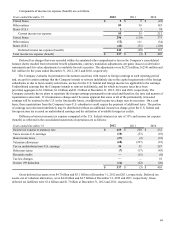
Earnings Per Common Share
Basic and diluted earnings per common share from both continuing operations and net earnings attributable to Motorola
Solutions, Inc., including discontinued operations, is computed as follows:
Continuing Operations
Net Earnings
attributable to
Motorola Solutions, Inc.
Years ended December 31 2012 2011 2010 2012 2011 2010
Basic earnings per common
share:
Earnings $ 878 $ 747 $ 244 $ 881 $ 1,158 $ 633
Weighted average common
shares outstanding 292.1 333.8 333.3 292.1 333.8 333.3
Per share amount $ 3.01 $ 2.24 $ 0.73 $ 3.01 $ 3.47 $ 1.90
Diluted earnings per
common share:
Earnings $ 878 $ 747 $ 244 $ 881 $ 1,158 $ 633
Weighted average common
shares outstanding 292.1 333.8 333.3 292.1 333.8 333.3
Add effect of dilutive
securities:
Share-based awards and other 5.3 5.9 4.8 5.3 5.9 4.8
Diluted weighted average
common shares outstanding 297.4 339.7 338.1 297.4 339.7 338.1
Per share amount $ 2.95 $ 2.20 $ 0.72 $ 2.96 $ 3.41 $ 1.87
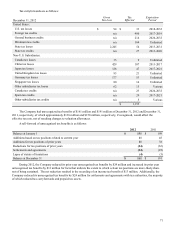
In the computation of diluted earnings per common share from both continuing operation and on a net earnings basis for
the year ended December 31, 2012, the assumed exercise of 5.9 million stock options was excluded because their inclusion
would have been antidilutive. For the year ended December 31, 2011, the assumed exercise of 8.6 million stock options and
vesting of 0.2 million restricted stock units were excluded because their inclusion would have been antidilutive. For the year
ended December 31, 2010, the assumed exercise of 14.6 million stock options and vesting of 0.7 million restricted stock units
were excluded because their inclusion would have been antidilutive.
During 2012, the Company paid an aggregate of $2.4 billion, including transaction costs, to repurchase 49.6 million
shares. The share repurchase program is discussed in further detail in the “Stockholders’ Equity Information” section.