Motorola 2012 Annual Report Download - page 35
Download and view the complete annual report
Please find page 35 of the 2012 Motorola annual report below. You can navigate through the pages in the report by either clicking on the pages listed below, or by using the keyword search tool below to find specific information within the annual report.-
 1
1 -
2
-
3
-
4
-
5
-
6
-
7
-
8
-
9
-
10
-
11
-
12
-
13
-
14
-
15
-
16
-
17
-
18
-
19
-
20
-
21
-
22
-
23
-
24
-
 25
25 -
 26
26 -
 27
27 -
 28
28 -
 29
29 -
 30
30 -
 31
31 -
 32
32 -
 33
33 -
 34
34 -
 35
35 -
 36
36 -
 37
37 -
 38
38 -
 39
39 -
 40
40 -
 41
41 -
 42
42 -
 43
43 -
 44
44 -
 45
45 -
46
-
47
-
48
-
49
-
50
-
51
-
52
-
53
-
54
-
55
-
56
-
57
-
58
-
59
-
60
-
61
-
62
-
63
-
64
-
65
-
66
-
67
-
68
-
69
-
70
-
71
-
72
-
73
-
74
-
75
-
76
-
77
-
78
-
79
-
80
-
81
-
82
-
83
-
84
-
85
-
86
-
87
-
88
-
89
-
90
-
91
-
92
-
93
-
94
-
95
-
96
-
97
-
98
-
99
-
100
-
101
-
102
-
103
-
104
-
105
-
106
-
107
-
108
-
109
-
110
-
111
-
112
-
113
-
114
-
115
-
116
-
117
-
118
-
119
-
120
 |
 |

27
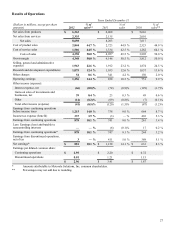
Results of Operations
Years Ended December 31
(Dollars in millions, except per share
amounts) 2012
% of
sales** 2011
% of
sales 2010
% of
sales**
Net sales from products $ 6,363 $ 6,068 $ 5,616
Net sales from services 2,335 2,135 2,001
Net sales 8,698 8,203 7,617
Cost of product sales 2,844 44.7 % 2,723 44.9 % 2,523 44.9 %
Cost of service sales 1,506 64.5 % 1,334 62.5 % 1,282 64.1 %
Costs of sales 4,350 50.0 % 4,057 49.5 % 3,805 50.0 %
Gross margin 4,348 50.0 % 4,146 50.5 % 3,812 50.0 %
Selling, general and administrative
expenses 1,963 22.6 % 1,912 23.2 % 1,874 24.5 %
Research and development expenditures 1,075 12.4 % 1,035 12.6 % 1,037 13.6 %
Other charges 54 0.6 % 341 4.2 % 150 2.0 %
Operating earnings 1,256 14.4 % 858 10.5 % 751 9.9 %
Other income (expense):
Interest expense, net (66) (0.8)% (74) (0.9)% (129) (1.7)%
Gains on sales of investments and
businesses, net 39 0.4 % 23 0.3 % 49 0.6 %
Other (14) (0.2)% (69) (0.8)% (7) (0.1)%
Total other income (expense) (41) (0.5)% (120) (1.5)% (87) (1.2)%
Earnings from continuing operations
before income taxes 1,215 14.0 % 738 9.0 % 664 8.7 %
Income tax expense (benefit) 337 3.9 % (3) — % 403 5.3 %
Earnings from continuing operations 878 10.1 % 741 9.0 % 261 3.4 %
Less: Earnings (loss) attributable to
noncontrolling interests ——% (6) (0.1)% 17 0.2 %
Earnings from continuing operations* 878 10.1 % 747 9.1 % 244 3.2 %
Earnings from discontinued operations,
net of tax 3—% 411 5.0 % 389 5.1 %
Net earnings* $ 881 10.1 % $ 1,158 14.1 % $ 633 8.3 %
Earnings per diluted common share:
Continuing operations $ 2.95 $ 2.20 $ 0.72
Discontinued operations 0.01 1.21 1.15
$ 2.96 $ 3.41 $ 1.87
* Amounts attributable to Motorola Solutions, Inc. common shareholders.
** Percentages may not add due to rounding.