Motorola 2005 Annual Report Download - page 97
Download and view the complete annual report
Please find page 97 of the 2005 Motorola annual report below. You can navigate through the pages in the report by either clicking on the pages listed below, or by using the keyword search tool below to find specific information within the annual report.-
 1
1 -
2
-
3
-
4
-
5
-
6
-
7
-
8
-
9
-
10
-
11
-
12
-
13
-
14
-
15
-
16
-
17
-
18
-
19
-
20
-
21
-
22
-
23
-
24
-
25
-
26
-
27
-
28
-
29
-
30
-
31
-
32
-
33
-
34
-
35
-
36
-
37
-
38
-
39
-
40
-
41
-
42
-
43
-
44
-
45
-
46
-
47
-
48
-
49
-
50
-
51
-
52
-
53
-
54
-
55
-
56
-
57
-
58
-
59
-
60
-
61
-
62
-
63
-
64
-
65
-
66
-
67
-
68
-
69
-
70
-
71
-
72
-
73
-
74
-
75
-
76
-
77
-
78
-
79
-
80
-
81
-
82
-
83
-
84
-
85
-
86
-
 87
87 -
 88
88 -
 89
89 -
 90
90 -
 91
91 -
 92
92 -
 93
93 -
 94
94 -
 95
95 -
 96
96 -
 97
97 -
 98
98 -
 99
99 -
 100
100 -
 101
101 -
 102
102 -
 103
103 -
 104
104 -
 105
105 -
 106
106 -
 107
107 -
108
-
109
-
110
-
111
-
112
-
113
-
114
-
115
-
116
-
117
-
118
-
119
-
120
-
121
-
122
-
123
-
124
-
125
-
126
-
127
-
128
-
129
-
130
-
131
-
132
-
133
-
134
-
135
-
136
-
137
-
138
-
139
-
140
-
141
-
142
 |
 |

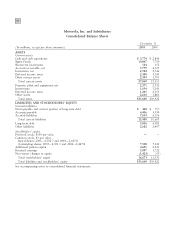
90
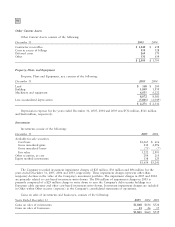
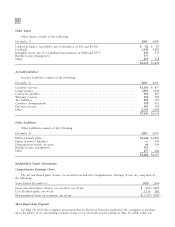
Other Current Assets
Other Current Assets consists of the following:
December 31
2005
2004
Contractor receivables $ 1,240 $ 658
Costs in excess of billings 359 328
Deferred costs 263 170
Other 531 639
$ 2,393 $ 1,795
Property, Plant, and Equipment
Property, Plant and Equipment, net, consists of the following:
December 31
2005
2004
Land $ 168 $ 200
Building 1,849 1,959
Machinery and equipment 6,055 6,222
8,072 8,381
Less accumulated depreciation (5,801) (6,049)
$ 2,271 $ 2,332
Depreciation expense for the years ended December 31, 2005, 2004 and 2003 was $532 million, $561 million
and $664 million, respectively.
Investments
Investments consist of the following:
December 31
2005
2004
Available-for-sale securities:
Cost basis $1,065 $ 616
Gross unrealized gains 232 2,296
Gross unrealized losses (75) (7)
Fair value 1,222 2,905
Other securities, at cost 294 213
Equity method investments 138 123
$1,654 $3,241
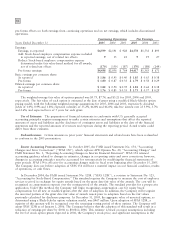
The Company recorded investment impairment charges of $25 million, $36 million and $96 million for the
years ended December 31, 2005, 2004 and 2003, respectively. These impairment charges represent other-than-
temporary declines in the value of the Company's investment portfolio. The impairment charges in 2005 and 2004
are primarily related to cost-based investment write-downs. The $96 million of impairment charges in 2003 is
primarily comprised of a $29 million charge to write down to zero the Company's debt security holdings in a
European cable operator and other cost-based investment write-downs. Investment impairment charges are included
in Other within Other income (expense) in the Company's consolidated statements of operations.
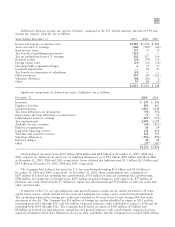
Gains on sales of investments and businesses, consists of the following:
Years Ended December 31
2005
2004 2003
Gains on sales of investments $1,848 $434 $524
Gains on sales of businesses 13 26 15
$1,861 $460 $539