Motorola 2005 Annual Report Download - page 58
Download and view the complete annual report
Please find page 58 of the 2005 Motorola annual report below. You can navigate through the pages in the report by either clicking on the pages listed below, or by using the keyword search tool below to find specific information within the annual report.-
 1
1 -
2
-
3
-
4
-
5
-
6
-
7
-
8
-
9
-
10
-
11
-
12
-
13
-
14
-
15
-
16
-
17
-
18
-
19
-
20
-
21
-
22
-
23
-
24
-
25
-
26
-
27
-
28
-
29
-
30
-
31
-
32
-
33
-
34
-
35
-
36
-
37
-
38
-
39
-
40
-
41
-
42
-
43
-
44
-
45
-
46
-
47
-
 48
48 -
 49
49 -
 50
50 -
 51
51 -
 52
52 -
 53
53 -
 54
54 -
 55
55 -
 56
56 -
 57
57 -
 58
58 -
 59
59 -
 60
60 -
 61
61 -
 62
62 -
 63
63 -
 64
64 -
 65
65 -
 66
66 -
 67
67 -
 68
68 -
69
-
70
-
71
-
72
-
73
-
74
-
75
-
76
-
77
-
78
-
79
-
80
-
81
-
82
-
83
-
84
-
85
-
86
-
87
-
88
-
89
-
90
-
91
-
92
-
93
-
94
-
95
-
96
-
97
-
98
-
99
-
100
-
101
-
102
-
103
-
104
-
105
-
106
-
107
-
108
-
109
-
110
-
111
-
112
-
113
-
114
-
115
-
116
-
117
-
118
-
119
-
120
-
121
-
122
-
123
-
124
-
125
-
126
-
127
-
128
-
129
-
130
-
131
-
132
-
133
-
134
-
135
-
136
-
137
-
138
-
139
-
140
-
141
-
142
 |
 |

51
MANAGEMENT'S DISCUSSION AND ANALYSIS
OF FINANCIAL CONDITION AND RESULTS OF OPERATIONS
who resigned from the Company and did not receive severance or were redeployed due to circumstances not
foreseen when the original plans were approved.
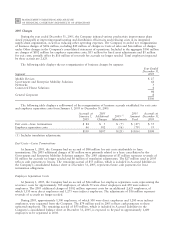
During 2003, approximately 5,200 employees, of which 2,000 were direct employees and 3,200 were indirect
employees, were separated from the Company. The $258 million used in 2003 reflects $254 million of cash
payments to these separated employees and $4 million of non-cash utilization. The remaining accrual of
$116 million was included in Accrued liabilities in the Company's consolidated balance sheet at December 31,
2003.
Liquidity and Capital Resources
As highlighted in the consolidated statements of cash flows, the Company's liquidity and available capital
resources are impacted by four key components: (i) current cash and cash equivalents, (ii) operating activities,
(iii) investing activities, and (iv) financing activities.
Cash and Cash Equivalents
During 2005, the Company's cash and cash equivalents (which are highly-liquid investments with an original
maturity of three months or less) increased by $928 million to $3.8 billion at December 31, 2005, compared to
$2.8 billion at December 31, 2004. At December 31, 2005, $169 million of this amount was held in the U.S. and
$3.6 billion was held by the Company or its subsidiaries in other countries.
On October 22, 2004, the American Jobs Creation Act of 2004 (the ""Act'') was signed into law. The Act
provided for a special one-time tax incentive for U.S. multinationals to repatriate accumulated earnings from their
foreign subsidiaries by providing an 85% dividends received deduction for certain qualifying dividends. During 2005,
the Company repatriated approximately $4.6 billion of accumulated foreign earnings and recorded an associated net
income tax benefit of $265 million. The net income tax benefit included a $303 million tax benefit relating to the
repatriation under the Act, offset by a $38 million tax charge for the reassessment of the Company's cash position
and related tax liability associated with the remaining foreign undistributed earnings. Repatriation of additional
funds held outside the U.S. could be subject to delay and could have potential adverse tax consequences.
Reclassification of Sigma Funds: The Company and its wholly-owned subsidiaries invest most of their excess
cash in two funds (the ""Sigma Funds''), which are funds similar to a money market fund. Until the first quarter of
2005, the Sigma Funds marketable securities balances were classified together with other money-market type cash
investments as cash and cash equivalents. In the first quarter of 2005, to provide enhanced disclosure, the Company
reclassified the Sigma Funds investments out of cash and cash equivalents and into a separate statement line entitled
Sigma Funds as described below in ""Investing Activities.'' The Sigma Funds balance was $10.9 billion at
December 31, 2005, compared to $7.7 billion at December 31, 2004. At December 31, 2005, $8.7 billion of the
Sigma Funds investments were held in the U.S. and $2.2 billion were held by the Company or its subsidiaries in
other countries.
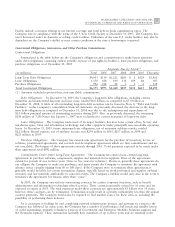
Operating Activities
The Company has generated positive cash flow from continuing operations in each of the last 5 years. The
cash provided by operating activities from continuing operations in 2005 was $4.6 billion, compared to $3.1 billion
in 2004 and $2.0 billion in 2003. The primary contributors to cash flow from operations in 2005 were: (i) earnings
from continuing operations (adjusted for non-cash items) of $4.6 billion, of which $500 million was received for
the settlement of financial and legal claims against Telsim, (ii) a $2.3 billion increase in accounts payable and
accrued liabilities and (iii) a $23 million decrease in inventories. These positive contributors to operating cash flow
were partially offset by: (i) a $1.3 billion increase in accounts receivable, (ii) a $703 million increase in other
current assets, and (iii) $371 million increase in other assets and other liabilities.
Accounts Receivable: The Company's net accounts receivable were $5.8 billion at December 31, 2005,
compared to $4.5 billion at December 31, 2004. The Company's days sales outstanding (""DSO''), including net
long-term receivables, were 50 days at December 31, 2005, compared to 46 days at December 31, 2004. The
Company's businesses sell their products in a variety of markets throughout the world. Payment terms can vary by
market type and geographic location. Accordingly, the Company's levels of accounts receivable and DSO can be
impacted by the timing and level of sales that are made by its various businesses and by the geographic locations in
which those sales are made.