Mitsubishi 2005 Annual Report Download - page 4
Download and view the complete annual report
Please find page 4 of the 2005 Mitsubishi annual report below. You can navigate through the pages in the report by either clicking on the pages listed below, or by using the keyword search tool below to find specific information within the annual report.-
 1
1 -
 2
2 -
 3
3 -
 4
4 -
 5
5 -
 6
6 -
 7
7 -
 8
8 -
 9
9 -
 10
10 -
 11
11 -
 12
12 -
 13
13 -
 14
14 -
 15
15 -
16
-
17
-
18
-
19
-
20
-
21
-
22
-
23
-
24
-
25
-
26
-
27
-
28
-
29
-
30
-
31
-
32
-
33
-
34
-
35
-
36
-
37
-
38
-
39
-
40
-
41
-
42
-
43
-
44
-
45
-
46
-
47
-
48
-
49
-
50
-
51
-
52
-
53
-
54
-
55
-
56
-
57
-
58
-
59
-
60
-
61
-
62
-
63
-
64
-
65
-
66
-
67
-
68
-
69
-
70
-
71
-
72
-
73
-
74
-
75
-
76
-
77
-
78
-
79
-
80
-
81
-
82
-
83
-
84
 |
 |

Annual Report 2005
2
MITSUBISHI MOTORS CORPORATION
In thousands of
In millions of yen U.S. dollars
2001 2002 2003 2004 2005 2005
For the year:
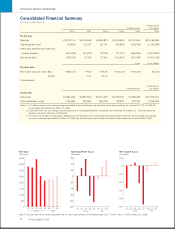
Net sales ¥3,276,716 ¥3,200,699 ¥3,884,874 ¥2,519,449 ¥2,122,626 $19,765,586
Operating profit (loss) (73,865) 40,227 82,761 (96,852) (128,544) (1,196,983)
Profit (loss) before income taxes and
minority interests (407,289) (31,875) 42,206 (77,173) (460,906) (4,291,892)
Net income (loss) (278,139) 11,256 37,361 (215,424) (474,785) (4,421,136)
In yen In U.S. dollars
Per share data:
Net income (loss) per share: Basic ¥(232.77) ¥7.66 ¥25.35 ¥(145.22) ¥(194.36) $(1.81)
Diluted – 7.42 23.43 – – –
Cash dividends – –––– –
In thousands of
In millions of yen U.S. dollars
At year-end:
Total assets ¥2,981,668 ¥2,894,560 ¥2,425,352 ¥2,029,035 ¥1,589,286 $14,799,202
Total stockholders’ equity 256,068 270,663 280,294 29,972 324,782 3,024,328
Notes: 1. U.S. dollar amounts in the accompanying consolidated financial statements are converted, solely for convenience, at a rate of ¥107.39 = U.S.$1.00,
the exchange rate prevailing on March 31, 2005.
2. In the year 2003, due to a change of accounting period at consolidated overseas subsidiaries, from December 31 to March 31, 15-month figures for
overseas subsidiaries have been incorporated.
3. The assets and liabilities of truck and bus operations are not reflected in each account because these operations were spun off and subsequently became
an equity-method affiliate of MMC on March 14, 2003 and all remaining shares had been transferred to other parties by the end of March 2005.
Consolidated Financial Summary
For the years ended March 31,
Actual Plan
07060504030201 08
0
500
1,000
1,500
2,000
2,500
3,000
3,500
4,000
Actual Plan
–150
–120
–90
–60
–30
0
30
60
90
060504030201 07 08
Net Sales
(¥ billion)
Operating Profit (Loss)
(¥ billion)
Actual Plan
–500
–400
–300
–200
–100
0
100
060504030201 07 08
Net Income (Loss)
(¥ billion)
Note: Fiscal year refers to the accounting period that runs from April to March of the following year (e.g. FY 2004 = April 1, 2004 to March 31, 2005).