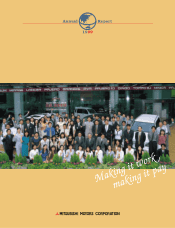
Mitsubishi 1999 Annual Report Download - page 3
Download and view the complete annual report
Please find page 3 of the 1999 Mitsubishi annual report below. You can navigate through the pages in the report by either clicking on the pages listed below, or by using the keyword search tool below to find specific information within the annual report.-
 1
1 -
 2
2 -
 3
3 -
 4
4 -
 5
5 -
 6
6 -
 7
7 -
 8
8 -
 9
9 -
 10
10 -
 11
11 -
 12
12 -
 13
13 -
 14
14 -
15
-
16
-
17
-
18
-
19
-
20
-
21
-
22
-
23
-
24
-
25
-
26
-
27
-
28
-
29
-
30
-
31
-
32
-
33
-
34
-
35
-
36
-
37
-
38
-
39
-
40
-
41
-
42
-
43
-
44
-
45
-
46
-
47
-
48
-
49
-
50
-
51
-
52
-
53
-
54
-
55
-
56
-
57
-
58
-
59
-
60
-
61
-
62
 |
 |

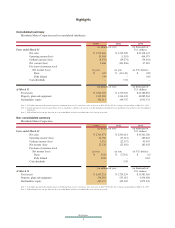
Highlights
1
Consolidated summary
Mitsubishi Motors Corporation and its consolidated subsidiaries.
1999 1998 1999
(in millions of yen) (in thousands of
Years ended March 31
U.S. dollars)
Net sales ¥ 3,512,606 ¥ 3,735,228 $ 29,138,167
Operating income(loss) 55,944 (1,301) 464,073
Ordinary income (loss) (4,176) (59,274) (34,641)
Net income (loss) 5,668 (101,846) 47,018
Per share of common stock
Net income (loss):
(in yen) (in yen) (in U.S. dollars)
Basic ¥ 6.15 ¥ (110.49) $ 0.05
Fully diluted 5.93 – 0.05
Cash dividends – 3.50 –
(in millions of yen) (in thousands of
At March 31
U.S. dollars)
Total assets ¥ 3,060,385 ¥ 3,370,526 $ 25,386,852
Property, plant and equipment 1,312,303 1,314,124 10,885,964
Stockholders' equity 353,613 349,747 2,933,331
Non-consolidated summary
Mitsubishi Motors Corporation
1999 1998 1999
(in millions of yen) (in thousands of
Years ended March 31
U.S. dollars)
Net sales ¥ 2,333,971 ¥ 2,500,614 $ 19,361,020
Operating income (loss) 21,750 (15,512) 180,423
Ordinary income (loss) 5,231 (22,157) 43,393
Net income (loss) 22,138 (25,656) 183,642
Per share of common stock
Net income (loss):
(in yen) (in yen) (in U.S. dollars)
Basic ¥ 24.02 ¥ (27.83) $ 0.2
Fully diluted 22.03 – 0.18
Cash dividends – 3.50 –
(in millions of yen) (in thousands of
At March 31
U.S. dollars)
Total assets ¥ 1,637,233 ¥ 1,724,254 $ 13,581,360
Property, plant and equipment 534,592 535,081 4,434,608
Stockholders' equity 467,171 445,032 3,875,330
Highlights
Note 1 :U.S. dollar amounts in this annual report are translated from yen, for convenience only, at the rate of ¥120.55=U.S. $1, the exchange rate prevailing on March 31, 1999.
Note 2: Fully diluted net income per share for the year ended March 1998 is not available due to the loss for the period.
Note 1 :U.S. dollar amounts in this annual report are translated from yen, for convenience only, at the rate of ¥120.55=U.S. $1, the exchange rate prevailing on March 31, 1999.
Note 2: Certain amounts previously reported have been reclassified to conform to the current year. The principal reclassifications are detailed in 1 (n) of Notes to the Consolidated
Statements.
Note 3: Fully diluted net income per share for the year ended March 1998 is not available due to the loss for the period.