Mercury Insurance 2015 Annual Report Download - page 6
Download and view the complete annual report
Please find page 6 of the 2015 Mercury Insurance annual report below. You can navigate through the pages in the report by either clicking on the pages listed below, or by using the keyword search tool below to find specific information within the annual report.-
 1
1 -
 2
2 -
 3
3 -
 4
4 -
 5
5 -
 6
6 -
 7
7 -
 8
8 -
 9
9 -
 10
10 -
 11
11 -
 12
12 -
 13
13 -
 14
14 -
 15
15 -
 16
16 -
 17
17 -
18
-
19
-
20
-
21
-
22
-
23
-
24
-
25
-
26
-
27
-
28
-
29
-
30
-
31
-
32
-
33
-
34
-
35
-
36
-
37
-
38
-
39
-
40
-
41
-
42
-
43
-
44
-
45
-
46
-
47
-
48
-
49
-
50
-
51
-
52
-
53
-
54
-
55
-
56
-
57
-
58
-
59
-
60
-
61
-
62
-
63
-
64
-
65
-
66
-
67
-
68
-
69
-
70
-
71
-
72
-
73
-
74
-
75
-
76
-
77
-
78
-
79
-
80
-
81
-
82
-
83
-
84
-
85
-
86
-
87
-
88
-
89
-
90
-
91
-
92
-
93
-
94
-
95
-
96
-
97
-
98
-
99
-
100
-
101
-
102
-
103
-
104
-
105
-
106
-
107
-
108
-
109
-
110
-
111
-
112
-
113
-
114
-
115
-
116
-
117
-
118
-
119
-
120
-
121
-
122
 |
 |

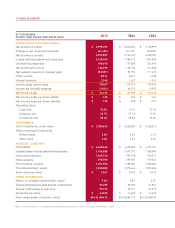
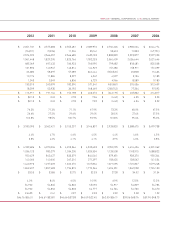
10 YEAR SUMMARY
*
Ratio of (i) net income less net realized investment (losses) gains, net of tax to (ii) average shareholders’ equity
2015 2014 2013
OPERATING RESULTS (GAAP BASIS)
Net premiums written $ 2,999,392 $ 2,840,922 $ 2,728,999
Change in net unearned premiums (41,495) (44,727) (30,812)
Net premiums earned 2,957,897 2,796,195 2,698,187
Losses and loss adjustment expenses 2,145,495 1,986,122 1,962,690
Underwriting expenses 790,070 775,589 724,995
Net investment income 126,299 125,723 124,538
Net realized investment (losses) gains (83,807) 81,184 (11,422)
Other income 8,911 8,671 9,738
Interest expense 3,168 2,637 1,260
Income (loss) before taxes 70,567 247,425 132,096
Income tax (benefit) expense (3,912) 69,476 19,953
Net income (loss) $ 74,479 $ 177,949 $ 112,143
Net income (loss) per share (basic) $ 1.35 $3.23 $ 2.04
Net income (loss) per share (diluted) $ 1.35 $ 3.23 $ 2.04
Operating ratios
Loss ratio 72.5% 71.0% 72.7%
Expense ratio 26.7% 27.7% 26.9%
Combined ratio 99.2% 98.8% 99.6%
INVESTMENTS
Total investments, at fair value $ 3,380,642 $ 3,403,822 $ 3,158,312
Yield on average investments
Before taxes 3.8% 3.9% 4.1%
After taxes 3.4% 3.5% 3.6%
FINANCIAL CONDITION
Total assets $ 4,628,645 $ 4,600,289 $ 4,315,181
Unpaid losses and loss adjustment expenses 1,146,688 1,091,797 1,038,984
Unearned premiums 1,049,314 999,798 953,527
Notes payable 290,000 290,000 190,000
Policyholders’ surplus 1,451,950 1,438,281 1,528,682
Total shareholders’ equity 1,820,885 1,875,446 1,822,486
Book value per share $ 33.01 $ 34.02 $ 33.15
OTHER INFORMATION
Return on average shareholders’ equity* 7.0% 6.8% 6.5%
Diluted weighted average shares outstanding 55,209 55,020 54,964
Shares outstanding at year-end 55,164 55,121 54,975
Dividends per share $ 2.4725 $ 2.4625 $ 2.4525
Price range (bids) of common stock $60.31-$45.12 $59.68-$41.70 $51.00-$36.03
IN THOUSANDS,
EXCEPT PER SHARE AND RATIO DATA