Mercury Insurance 2015 Annual Report Download - page 3
Download and view the complete annual report
Please find page 3 of the 2015 Mercury Insurance annual report below. You can navigate through the pages in the report by either clicking on the pages listed below, or by using the keyword search tool below to find specific information within the annual report.-
 1
1 -
 2
2 -
 3
3 -
 4
4 -
 5
5 -
 6
6 -
 7
7 -
 8
8 -
 9
9 -
 10
10 -
 11
11 -
 12
12 -
 13
13 -
 14
14 -
15
-
16
-
17
-
18
-
19
-
20
-
21
-
22
-
23
-
24
-
25
-
26
-
27
-
28
-
29
-
30
-
31
-
32
-
33
-
34
-
35
-
36
-
37
-
38
-
39
-
40
-
41
-
42
-
43
-
44
-
45
-
46
-
47
-
48
-
49
-
50
-
51
-
52
-
53
-
54
-
55
-
56
-
57
-
58
-
59
-
60
-
61
-
62
-
63
-
64
-
65
-
66
-
67
-
68
-
69
-
70
-
71
-
72
-
73
-
74
-
75
-
76
-
77
-
78
-
79
-
80
-
81
-
82
-
83
-
84
-
85
-
86
-
87
-
88
-
89
-
90
-
91
-
92
-
93
-
94
-
95
-
96
-
97
-
98
-
99
-
100
-
101
-
102
-
103
-
104
-
105
-
106
-
107
-
108
-
109
-
110
-
111
-
112
-
113
-
114
-
115
-
116
-
117
-
118
-
119
-
120
-
121
-
122
 |
 |

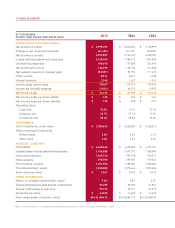
Our 2014 operating results and ratios were distorted by an
unexpected $27.6 million fine imposed by the California Insurance
Commissioner. Accordingly, all Companywide and California
Personal Auto comparisons to 2014 are exclusive of the fine.
During 2015, the insurance industry experienced an increase in both
the frequency and severity of auto claims. Mercury was not immune
from this trend as our loss costs also increased. Although we took
and are continuing to take action to offset increases in loss costs,
our operating results nevertheless fell short of expectations in 2015.
Our 2015 operating earnings were $2.34 per share compared
to $2.78 per share in 2014, a 15.8% decline. The deterioration
in operating earnings was primarily due to an increase in the
combined ratio from 97.8% in 2014 to 99.2% in 2015. Although
our California Private Passenger Automobile combined ratio did
not change as compared to 2014, our Commercial Automobile,
California Homeowners and Private Passenger Automobile results
outside of California deteriorated and offset our consistent California
Private Passenger Automobile results. In addition, $13 million of
adverse reserve development and $19 million of Catastrophe
losses also negatively impacted our 2015 operating results.
Despite the increase in frequency and severity, our California Private
Passenger Automobile combined ratio was 97.0% in both 2015
and 2014. Higher average premiums from rate increases taken
in the latter part of 2014 and in 2015 offset the year over year
increase in frequency and severity. However, we still fell short of
our 95% combined ratio target. To achieve our targeted profitability
levels and to keep up with loss trends, a 5% rate increase was
implemented in March 2016 for Mercury Insurance Company
and a 6.9% rate increase is pending approval from the California
Department of Insurance for California Automobile Insurance
Company. Mercury Insurance Company represents about half of
our Companywide premiums written and California Automobile
Insurance Company represents about 15% of our Companywide
premiums written.
We’ve made significant progress over the past few years in our
operations outside of California as we’ve driven down our accident
year Private Passenger Automobile combined ratio every year since
2009 to a low of 100% in 2014. However, in 2015 we took a step
backward. Our results outside of California were disappointing
as we posted an accident year Private Passenger Automobile
combined ratio of 108% in 2015. The deterioration in the combined
ratio outside of California was primarily driven by our two largest
states, Florida and Texas. In Florida and Texas, we posted calendar
year Private Passenger Automobile combined ratios of 102.7%
and 113.8%, respectively, in 2015 compared to 96.6% and 96.1%,
respectively, in 2014. We experienced significant growth in many
states in 2015 and that growth came at a price. New business
sales increased 14.3% in Florida and 46.1% in Texas and premiums
written grew 15% and 29.5%, respectively. The increase in loss
costs trends coupled with our new business growth penalty were
the main reasons for our poor results outside of California. To
address our profitability we are increasing rates in many states
and are tightening our underwriting.
Part of our long-term strategy is to continue to grow our
Homeowners and Commercial lines of business. In August 2014,
we launched a new Homeowners product in California with
refined pricing and new technology. The new product was very
well received as new business applications increased over 17.5%
in 2015. Companywide, our Homeowners line grew 7% in 2015
to $395 million in premiums written.
MERCURY GENERAL CORPORATION 2015 ANNUAL REPORT
LETTER TO SHAREHOLDERS
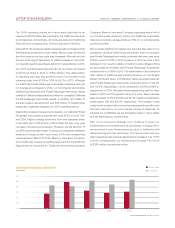
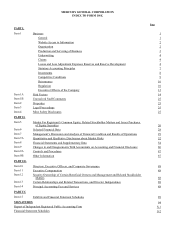
COMBINED RATIO VS. INDUSTRY
(In percent)
105
103
97
95
93
99
101
20152011 2012 2013 2014
Mercury General
U.S. Industry
Source for Industry Data: A.M. Best Company