Mercury Insurance 2010 Annual Report Download - page 5
Download and view the complete annual report
Please find page 5 of the 2010 Mercury Insurance annual report below. You can navigate through the pages in the report by either clicking on the pages listed below, or by using the keyword search tool below to find specific information within the annual report.-
 1
1 -
 2
2 -
 3
3 -
 4
4 -
 5
5 -
 6
6 -
 7
7 -
 8
8 -
 9
9 -
 10
10 -
 11
11 -
 12
12 -
 13
13 -
 14
14 -
 15
15 -
 16
16 -
17
-
18
-
19
-
20
-
21
-
22
-
23
-
24
-
25
-
26
-
27
-
28
-
29
-
30
-
31
-
32
-
33
-
34
-
35
-
36
-
37
-
38
-
39
-
40
-
41
-
42
-
43
-
44
-
45
-
46
-
47
-
48
-
49
-
50
-
51
-
52
-
53
-
54
-
55
-
56
-
57
-
58
-
59
-
60
-
61
-
62
-
63
-
64
-
65
-
66
-
67
-
68
-
69
-
70
-
71
-
72
-
73
-
74
-
75
-
76
-
77
-
78
-
79
-
80
-
81
-
82
-
83
-
84
-
85
-
86
-
87
-
88
-
89
-
90
-
91
-
92
-
93
-
94
-
95
-
96
-
97
-
98
-
99
-
100
-
101
-
102
-
103
-
104
-
105
-
106
-
107
-
108
-
109
-
110
-
111
-
112
-
113
-
114
-
115
-
116
-
117
-
118
-
119
-
120
-
121
-
122
-
123
-
124
-
125
-
126
 |
 |

3
2010 ANNUAL REPORT
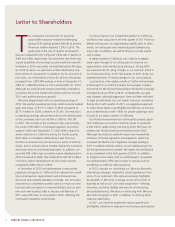
our bottom line. Our priorities for 2011 include:
• Implementing improved pricing segmentation and overall rate adequacy;
• Introducing new homeowners products in Georgia, Oklahoma, Texas
and Illinois;
• Introducing a new commercial auto product in Texas;
• Continuing to invest in our technology to make it easier for our agents
and customers to transact business with us;
• Increasing customer reach by leveraging the Internet more effectively
and increasing the number of relationships with qualified agents;
• Withdrawing from the Florida homeowners market;
• Managing expenses prudently; and
• Continuing our Service Excellence program.
Net investment income, which excludes realized gains and losses, was
$128.9 million after-tax in 2010, compared to $130.1 million in 2009.
The slight decrease in after–tax investment income was attributable to a
reduction in the amount of invested assets as the after-tax yield for both
2010 and 2009 was 4.1%.
Our balance sheet continues to be very strong. At year-end, our sharehold-
ers’ equity was $1.8 billion and underwriting leverage remains conservative,
with a premium to surplus ratio of 1.9 to 1. In November 2010, Mercury’s
Board of Directors increased the dividend rate by 1.7% to $0.60 per share,
continuing to provide a generous yield based on the recent market price of
our stock. Although our expectation is to continue to distribute our capital
back to our shareholders through dividends, we evaluate our dividend policy
quarterly based on our financial results and capital position.
Lastly, we were very disappointed that Proposition 17, the Continuous
Coverage Auto Insurance Discount Act, did not pass by a small margin in
California’s June 2010 election. Proposition 17 would have allowed insur-
ance companies to offer new customers discounts based on having continu-
ous insurance coverage from any insurance company. Currently, companies
may only offer a continuous coverage discount with existing customers.
Irrespective of our disappointment with Proposition 17’s defeat, we will
continue to implement new discounts in California that will allow Mercury to
better compete for new business.
We hope you will be able to attend our annual meeting on May 11, 2011.
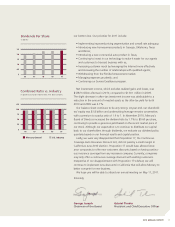
Dividends Per Share
(in dollars)
1.0
2.5
0
1.5
0.5
2.0
06 07 08 09 10
Combined Ratio vs. Industry
(in percent) Source for industry data: A.M. Best Company
50
125
0
75
25
100
06 07 08 09 10
U.S. IndustryMercury General
Gabriel Tirador
President and Chief Executive Officer
George Joseph
Chairman of the Board
Sincerely,