Mercury Insurance 2010 Annual Report Download - page 17
Download and view the complete annual report
Please find page 17 of the 2010 Mercury Insurance annual report below. You can navigate through the pages in the report by either clicking on the pages listed below, or by using the keyword search tool below to find specific information within the annual report.-
 1
1 -
2
-
3
-
4
-
5
-
6
-
 7
7 -
 8
8 -
 9
9 -
 10
10 -
 11
11 -
 12
12 -
 13
13 -
 14
14 -
 15
15 -
 16
16 -
 17
17 -
 18
18 -
 19
19 -
 20
20 -
 21
21 -
 22
22 -
 23
23 -
 24
24 -
 25
25 -
 26
26 -
 27
27 -
28
-
29
-
30
-
31
-
32
-
33
-
34
-
35
-
36
-
37
-
38
-
39
-
40
-
41
-
42
-
43
-
44
-
45
-
46
-
47
-
48
-
49
-
50
-
51
-
52
-
53
-
54
-
55
-
56
-
57
-
58
-
59
-
60
-
61
-
62
-
63
-
64
-
65
-
66
-
67
-
68
-
69
-
70
-
71
-
72
-
73
-
74
-
75
-
76
-
77
-
78
-
79
-
80
-
81
-
82
-
83
-
84
-
85
-
86
-
87
-
88
-
89
-
90
-
91
-
92
-
93
-
94
-
95
-
96
-
97
-
98
-
99
-
100
-
101
-
102
-
103
-
104
-
105
-
106
-
107
-
108
-
109
-
110
-
111
-
112
-
113
-
114
-
115
-
116
-
117
-
118
-
119
-
120
-
121
-
122
-
123
-
124
-
125
-
126
 |
 |

• Fixed-maturity securities are reported at fair value rather than at amortized cost, or the lower of
amortized cost or fair value, depending on the specific type of security as required by SAP.
• The differing treatment of income and expense items results in a corresponding difference in federal
income tax expense. Changes in deferred income taxes are reflected as an item of income tax benefit or
expense, rather than recorded directly to statutory surplus as regards policyholders, as required by
SAP. Admittance testing under SAP may result in a charge to unassigned surplus for non-admitted
portions of deferred tax assets. Under GAAP, a valuation allowance may be recorded against the
deferred tax assets and reflected as an expense.
• Certain assessments paid to regulatory agencies that are recoverable from policyholders in future
periods are expensed whereas these amounts are recorded as receivables under SAP.
Operating Ratios (SAP basis)
Loss and Expense Ratios
Loss and expense ratios are used to interpret the underwriting experience of property and casualty insurance
companies. Under SAP, losses and loss adjustment expenses are stated as a percentage of premiums earned
because losses occur over the life of a policy, while underwriting expenses are stated as a percentage of
premiums written rather than premiums earned because most underwriting expenses are incurred when policies
are written and are not spread over the policy period. The statutory underwriting profit margin is the extent to
which the combined loss and expense ratios are less than 100%. The Insurance Companies’ loss ratio, expense
ratio, combined ratio, and the private passenger automobile industry combined ratio, on a statutory basis, are
shown in the following table. The Insurance Companies’ ratios include lines of insurance other than private
passenger automobile. Since these other lines represent only 17.3% of premiums written, the Company believes
its ratios can be compared to the industry ratios included in the following table.
Year Ended December 31,
2010 2009 2008 2007 2006
Loss Ratio ............................................ 71.0% 67.8% 73.3% 68.0% 67.4%
Expense Ratio ......................................... 29.1% 28.6% 28.5% 27.1% 27.1%
Combined Ratio ....................................... 100.1% 96.4% 101.8% 95.1% 94.5%
Industry combined ratio (all writers)(1) ...................... 99.0%(2) 100.8% 99.8% 98.3% 95.5%
Industry combined ratio (excluding direct writers)(1) ........... N/A 100.5% 100.8% 96.2% 94.7%
(1) Source: A.M. Best, Aggregates & Averages (2007 through 2010), for all property and casualty insurance
companies (private passenger automobile line only, after policyholder dividends).
(2) Source: A.M. Best, “Best’s Special Report U.S. Property/Casualty-Review & Preview, February 14, 2011”
Premiums to Surplus Ratio
The following table presents, for the periods indicated, the Insurance Companies’ statutory ratios of net
premiums written to policyholders’ surplus. Widely recognized guidelines established by the National
Association of Insurance Commissioners (the “NAIC”) indicate that this ratio should be no greater than 3 to 1.
Year Ended December 31,
2010 2009 2008 2007 2006
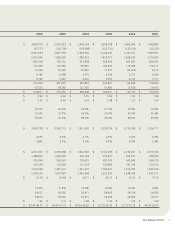
(Amounts in thousands, except ratios)
Net premiums written .................. $2,555,481 $2,589,972 $2,750,226 $2,982,024 $3,044,774
Policyholders’ surplus(1) ................ $1,322,270 $1,517,864 $1,371,095 $1,721,827 $1,579,248
Ratio ............................... 1.9to1 1.7to1 2.0to1 1.7to1 1.9to1
(1) The decrease in policyholders’ surplus in 2010 was primarily due to a $270 million extraordinary
intercompany dividend declared by MCC in the fourth quarter of 2010. The dividend is payable to Mercury
General in 2011.
7