Mercury Insurance 2010 Annual Report Download - page 15
Download and view the complete annual report
Please find page 15 of the 2010 Mercury Insurance annual report below. You can navigate through the pages in the report by either clicking on the pages listed below, or by using the keyword search tool below to find specific information within the annual report.-
 1
1 -
2
-
3
-
4
-
 5
5 -
 6
6 -
 7
7 -
 8
8 -
 9
9 -
 10
10 -
 11
11 -
 12
12 -
 13
13 -
 14
14 -
 15
15 -
 16
16 -
 17
17 -
 18
18 -
 19
19 -
 20
20 -
 21
21 -
 22
22 -
 23
23 -
 24
24 -
 25
25 -
26
-
27
-
28
-
29
-
30
-
31
-
32
-
33
-
34
-
35
-
36
-
37
-
38
-
39
-
40
-
41
-
42
-
43
-
44
-
45
-
46
-
47
-
48
-
49
-
50
-
51
-
52
-
53
-
54
-
55
-
56
-
57
-
58
-
59
-
60
-
61
-
62
-
63
-
64
-
65
-
66
-
67
-
68
-
69
-
70
-
71
-
72
-
73
-
74
-
75
-
76
-
77
-
78
-
79
-
80
-
81
-
82
-
83
-
84
-
85
-
86
-
87
-
88
-
89
-
90
-
91
-
92
-
93
-
94
-
95
-
96
-
97
-
98
-
99
-
100
-
101
-
102
-
103
-
104
-
105
-
106
-
107
-
108
-
109
-
110
-
111
-
112
-
113
-
114
-
115
-
116
-
117
-
118
-
119
-
120
-
121
-
122
-
123
-
124
-
125
-
126
 |
 |

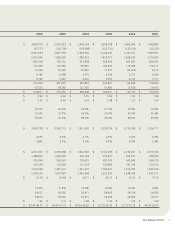
Company does not discount to a present value that portion of losses and loss adjustment expenses reserves
expected to be paid in future periods. The Tax Reform Act of 1986, however, requires the Company to discount
losses and loss adjustment expenses reserves for federal income tax purposes.
The following table presents the development of losses and loss adjustment expenses reserves for the period
2000 through 2010. The top section of the table shows the reserves at the balance sheet date, net of reinsurance
recoverable, for each of the indicated years. This amount represents the estimated net losses and loss adjustment
expenses for claims arising from the current and all prior years that are unpaid at the balance sheet date,
including an estimate for losses that had been incurred but not reported (“IBNR”) to the Company. The second
section shows the cumulative amounts paid as of successive years with respect to that reserve liability. The third
section shows the re-estimated amount of the previously recorded reserves based on experience as of the end of
each succeeding year, including cumulative payments made since the end of the respective year. Estimates
change as more information becomes known about the frequency and severity of claims for individual years. The
bottom line shows favorable (unfavorable) development that exists when the original reserve estimates are
greater (less) than the re-estimated reserves at December 31, 2010.
In evaluating the cumulative development information in the table, it should be noted that each amount
includes the effects of all changes in development amounts for prior periods. This table does not present accident
or policy year development data. Conditions and trends that have affected development of the liability in the past
may not necessarily occur in the future. Accordingly, it may not be appropriate to extrapolate future favorable or
unfavorable development based on this table.
December 31,
2000 2001 2002 2003 2004 2005 2006 2007 2008 2009 2010
(Amounts in thousands)
Gross Reserves for Losses and Loss
Adjustment Expenses-end of
year(1) ...................... $492,220 $534,926 $679,271 $797,927 $900,744 $1,022,603 $1,088,822 $1,103,915 $1,133,508 $1,053,334 $1,034,205
Reinsurance recoverable ......... (28,417) (18,334) (14,382) (11,771) (14,137) (16,969) (6,429) (4,457) (5,729) (7,748) (6,805)
Net Reserves for Losses and Loss
Adjustment Expenses-end of
year(1) ...................... $463,803 $516,592 $664,889 $786,156 $886,607 $1,005,634 $1,082,393 $1,099,458 $1,127,779 $1,045,586 $1,027,400
Paid (cumulative) as of:
One year later .............. $321,643 $360,781 $432,126 $461,649 $525,125 $ 632,905 $ 674,345 $ 715,846 $ 617,622 $ 603,256
Two years later ............ 431,498 481,243 591,054 628,280 748,255 891,928 975,086 1,009,141 913,518
Three years later ........... 462,391 528,052 637,555 714,763 851,590 1,027,781 1,123,179 1,168,246
Four years later ............ 476,072 538,276 655,169 740,534 893,436 1,077,834 1,187,990
Five years later ............. 478,158 545,110 664,051 750,927 906,466 1,101,693
Six years later ............. 481,775 549,593 667,277 754,710 915,086
Seven years later ........... 484,149 550,768 668,443 760,300
Eight years later ............ 485,600 550,827 671,474
Nine years later ............ 485,587 551,255
Ten years later ............. 485,889
Net reserves re-estimated as of:
One year later .............. 480,732 542,775 668,954 728,213 840,090 1,026,923 1,101,917 1,188,100 1,069,744 1,032,528
Two years later ............ 481,196 549,262 660,705 717,289 869,344 1,047,067 1,173,753 1,219,369 1,102,934
Three years later ........... 483,382 546,667 662,918 745,744 894,063 1,091,131 1,202,441 1,246,365
Four years later ............ 482,905 545,518 666,825 750,859 910,171 1,104,988 1,217,328
Five years later ............. 480,740 550,123 668,318 755,970 914,547 1,112,779
Six years later ............. 483,392 551,402 669,499 757,534 918,756
Seven years later ........... 485,328 551,745 670,225 762,242
Eight years later ............ 486,078 551,505 672,387
Nine years later ............ 486,157 551,721
Ten years later ............. 486,360
Net cumulative development
favorable (unfavorable) ........ $(22,557)$ (35,129)$ (7,498)$ 23,914 $ (32,149)$ (107,145)$ (134,935)$ (146,907)$ 24,845 $ 13,058
Gross re-estimated liability-latest . . .
$526,163 $581,688 $698,790 $791,649 $946,628 $1,144,164 $1,236,327 $1,261,953 $1,111,963 $1,040,308
Re-estimated recoverable-latest .... (39,803) (29,967) (26,403) (29,407) (27,872) (31,385) (18,999) (15,588) (9,029) (7,780)
Net re-estimated liability-latest .... $486,360 $551,721 $672,387 $762,242 $918,756 $1,112,779 $1,217,328 $1,246,365 $1,102,934 $1,032,528
Gross cumulative development
favorable (unfavorable) ........ $(33,943)$ (46,762)$ (19,519)$ 6,278 $ (45,884)$ (121,561) $ (147,505) $ (158,038) $ 21,545 $ 13,026
(1) Under statutory accounting principles (“SAP”), reserves are stated net of reinsurance recoverable whereas under U.S. generally accepted
accounting principles (“GAAP”), reserves are stated gross of reinsurance recoverable.
5