Marks and Spencer 2015 Annual Report Download - page 20
Download and view the complete annual report
Please find page 20 of the 2015 Marks and Spencer annual report below. You can navigate through the pages in the report by either clicking on the pages listed below, or by using the keyword search tool below to find specific information within the annual report.-
 1
1 -
2
-
3
-
4
-
5
-
6
-
7
-
8
-
9
-
 10
10 -
 11
11 -
 12
12 -
 13
13 -
 14
14 -
 15
15 -
 16
16 -
 17
17 -
 18
18 -
 19
19 -
 20
20 -
 21
21 -
 22
22 -
 23
23 -
 24
24 -
 25
25 -
 26
26 -
 27
27 -
 28
28 -
 29
29 -
 30
30 -
31
-
32
-
33
-
34
-
35
-
36
-
37
-
38
-
39
-
40
-
41
-
42
-
43
-
44
-
45
-
46
-
47
-
48
-
49
-
50
-
51
-
52
-
53
-
54
-
55
-
56
-
57
-
58
-
59
-
60
-
61
-
62
-
63
-
64
-
65
-
66
-
67
-
68
-
69
-
70
-
71
-
72
-
73
-
74
-
75
-
76
-
77
-
78
-
79
-
80
-
81
-
82
-
83
-
84
-
85
-
86
-
87
-
88
-
89
-
90
-
91
-
92
-
93
-
94
-
95
-
96
-
97
-
98
-
99
-
100
-
101
-
102
-
103
-
104
-
105
-
106
-
107
-
108
-
109
-
110
-
111
-
112
-
113
-
114
-
115
-
116
-
117
-
118
-
119
-
120
-
121
-
122
-
123
-
124
-
125
-
126
-
127
-
128
-
129
-
130
-
131
-
132
 |
 |

18
MARKS AND SPENCER GROUP PLC
STRATEGIC REPORT
OUR PERFORMANCE
FINANCIAL REVIEW CONTINUED
52 weeks ended
28 Mar 15
£m
29 Mar 14
£m % var
Retail sta ng 954.5 978.8 -2.5
Retail occupancy 1,116.4 1,054.4 +5.9
Distribution 408.7 445.5 -8.3
Marketing and related 167.6 147.7 +13.5
Support 560.2 533.2 +5.1
Total 3,207.4 3,159.6 +1.5
52 weeks ended
28 Mar 15
£m
29 Mar 14
£m
Net M&S Bank charges incurred in relation
to the insurance mis-selling provision (13.8) (50.8)
Restructuring costs (4.6) (77.3)
IAS 39 Fair value movement of
embedded derivative 1.3 (3.5)
(Loss)/profi t on disposal and impairment
once commitment to closure (6.9) 82.2
International store review (37.2) (21.9)
UK and Ireland one-o pension credits – 27.5
Strategic programme costs – (2.0)
Fees incurred on tax repayment – (1.6)
Adjustment to operating profi t(61.2)(47.4)
Interest income on tax repayment – 4.9
Adjustment to profi t before tax (61.2) (42.5)
UK operating costs were up £47.8m (1.5%), with higher depreciation
and asset impairments contributing £76.0m (2.4%) of the
total increase.
Retail sta ng costs were down in part as a result of lower
volumes, but also helped by better resource allocation following
the implementation of a new labour planning system. Our store
customer satisfaction scores were up on the year.
The increase in occupancy costs mainly reflects increased depreciation
and asset impairments arising from investment made in our UK store
environment as well as the addition of new space in Food.
Distribution costs were down, refl ecting new contractual terms with
a key Food logistics supplier, the benefi ts of the fi rst stage of our
single tier network and lower volumes in GM.
Marketing and related costs increased due to the re-launch of the
M&S brand, including new TV advertising campaigns across both
Food and GM.
Support costs were up largely due to higher depreciation on the
new M&S.com web platform and additional sta incentive costs this
year, partially o set by the release of employee benefi t provisions.
NET FINANCE COSTS
Net underlying interest payable was down 15.9% to £94.8m due to a
decrease in the average cost of funding to 5.0% (last year 5.4%) and
a £240.4m reduction in net debt. This has resulted in a decrease in
net fi nance costs of £12.8m.
Non-underlying adjustments to profi t were £61.2m net charge (last
year £42.5m net charge). The main element of these charges is a
provision for impairment in underperforming stores in Western
Europe, Ireland and China.
Full details of non-underlying items are disclosed in note 5 on p100.
TAX ATION
The full year underlying e ective tax rate was 18.9% (last year 18.8%)
and statutory e ective tax rate was 19.7% (last year 12.8%).
TOTAL TA X CONTRIBUTION
In 2015 our total cash tax contribution to the UK Exchequer was
£767m (2014:£803m1); split between taxes ultimately borne by the
Company of £388m (2014: £372m) (i.e. corporation tax, customs
duties, employer’s NIC, business rates and sundry taxes) and
taxes attributable to the Company’s economic activity which are
collected on behalf of the government of £379m (2014: £431m1)
(i.e. PAYE, employees’ NIC, value added tax, excise duties and
sundry taxes).
1. The 2014 numbers have been restated to exclude PAYE inrelation to pensioners paid
by the M&S Pension Trust.
£767m
Corporation tax 9%
Customs duties 8%
Employer’s NI 9%
Employees’ NI 7%
Other taxes 1%
Business rates 23%
Excise duties 14%
VAT 14%
PAYE 15%
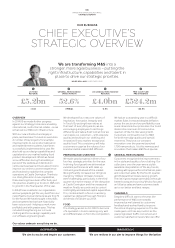
UNDERLYING PROFIT BEFORE TAX
Underlying profi t before tax grew by 6.1% to £661.2m (last year
£622.9m) as a result of the signifi cantly improved performance
in the UK business and lower interest costs.
NON-UNDERLYING PROFIT ITEMS
OPERATING COSTS
GROUP REVENUE
Group revenues were level (up 0.4% on a constant currency basis).
UK revenues were up 0.7% in total with a like-for-like decrease of
1.0%. International revenues were down 5.7% (down 2.1% on a
constant currency basis).
GROSS MARGIN
UK gross margin was up 75bps at 41.4% as a result of strong
improvement in GM margin.
UK GM gross margin was up 190bps at 52.6% driven mainly by an
improvement in buying margin as a result of sourcing initiatives.
Despite a highly promotional marketplace, we remained focused
on full price sales and we reduced the number of price promotions.
However, clearance markdown was higher due to additional stock
into sale as a result of unseasonal Autumn/Winter conditions.
Food gross margin was up 30bps at 32.8% due to ongoing
operational e ciencies. The benefi ts realised through streamlining
our operations have been reinvested in price and quality, and also
shared with our suppliers to help them create further e ciencies.