Marks and Spencer 2015 Annual Report Download - page 16
Download and view the complete annual report
Please find page 16 of the 2015 Marks and Spencer annual report below. You can navigate through the pages in the report by either clicking on the pages listed below, or by using the keyword search tool below to find specific information within the annual report.-
 1
1 -
2
-
3
-
4
-
5
-
 6
6 -
 7
7 -
 8
8 -
 9
9 -
 10
10 -
 11
11 -
 12
12 -
 13
13 -
 14
14 -
 15
15 -
 16
16 -
 17
17 -
 18
18 -
 19
19 -
 20
20 -
 21
21 -
 22
22 -
 23
23 -
 24
24 -
 25
25 -
 26
26 -
27
-
28
-
29
-
30
-
31
-
32
-
33
-
34
-
35
-
36
-
37
-
38
-
39
-
40
-
41
-
42
-
43
-
44
-
45
-
46
-
47
-
48
-
49
-
50
-
51
-
52
-
53
-
54
-
55
-
56
-
57
-
58
-
59
-
60
-
61
-
62
-
63
-
64
-
65
-
66
-
67
-
68
-
69
-
70
-
71
-
72
-
73
-
74
-
75
-
76
-
77
-
78
-
79
-
80
-
81
-
82
-
83
-
84
-
85
-
86
-
87
-
88
-
89
-
90
-
91
-
92
-
93
-
94
-
95
-
96
-
97
-
98
-
99
-
100
-
101
-
102
-
103
-
104
-
105
-
106
-
107
-
108
-
109
-
110
-
111
-
112
-
113
-
114
-
115
-
116
-
117
-
118
-
119
-
120
-
121
-
122
-
123
-
124
-
125
-
126
-
127
-
128
-
129
-
130
-
131
-
132
 |
 |

14
MARKS AND SPENCER GROUP PLC
STRATEGIC REPORT
OUR PERFORMANCE
KEY PERFORMANCE
INDICATORS
Reduce
impact
GROUP FINANCIAL OBJECTIVES
NON-FINANCIAL MEASURES
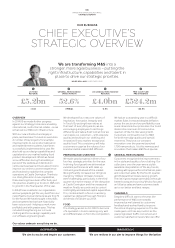
GROUP
REVENUE
UNDERLYING
GROUP PROFIT
BEFORE TAX
RETURN
ON CAPITAL
EMPLOYED
(ROCE)
UNDERLYING
EARNINGS
PER SHARE
FREE CASH
FLOW (PRE
DIVIDEND)
PRODUCTS
WITH A
PLAN A QUALITY
GROSS
GREENHOUSE
GAS EMISSIONS
GROSS GREENHOUSE
GAS EMISSIONS
PER 1,000 SQ FT
Total Group sales including retail sales for
owned business and wholesale sales to
franchise partners.
Group revenue was broadly fl at year-on-
year, with the growth in Food sales o set
by the decline in GM and International.
Underlying profi t provides additional
useful information on the underlying
performance of the business adjusting for
income and signifi cant one-o charges.
Underlying PBT grew as a result of a
signifi cantly improved performance in
the UK business.
Return on capital employed is a relative
profi t measurement that demonstrates
the return the business is generating from
its net operating assets.
The reduction in ROCE from last year
refl ects an increase in average net
operating assets, partially o set by
an increase in underlying earnings.
Earnings per Share (EPS) is the underlying
profi t divided by the average number of
ordinary shares in issue.
The weighted average number of shares
in issue during the period was 1,635.6m
(last year 1,615.0m).
Free cash fl ow is the net cash generated
by the business in the period before
dividend payment.
Improvement was driven by better
working capital management and
improvements in underlying EBITDA.
A quality or feature regarded as a
characteristic or inherent part of a
product which has a demonstrable
positive or signifi cantly lower
environmental and/or social impact
during its sourcing, production, supply,
use and/or disposal.
Total gross CO2e emissions resulting
from M&S operated activities worldwide.
We co ntinue to o set emissions to a
net fi gure of zero (carbon neutrality).
Total gross CO2e emissions
per 1,000 sq ft resulting from M&S
operated activities worldwide.
Looking ahead Our aim is for all
M&S p ro duc ts to have at le ast one
Pla nA q ua l it y by 2020. We h ave
targets to improve energy e ciency
by 50% and reduce refrigeration gas
emissions by 80% by 2020. We also
plan to continue to o set our gross
greenhouse gas emissions to zero
(carbon neutral).
OBJECTIVE KPI DEFINITION 2014/15 DATA
£10.3bn
Level
£661.2m
14.7%
33.1p
£524.2m
64%
592,000 CO2e
30 t CO2e/1,000sq ft
+6.1%
LY14.8%
+2.8%
+22.5%
+7%
+4.4%2
Level
13/14 £622.9m
13/14 £427.9m
13/14 14.8%
13/14 32.2p
13/14 17.0p
12/13 £648.1m
11/12 £705.9m1
12/13 £204.1m
11/12 £385.2m
12/13 15.8%
11/12 16.4%1
12/13 31.9p
11/12 34.9p1
12/13 17.0p
11/12 17.0p
Group revenue £bn
11/ 12 12 /13 13/14 14 /15
9.9 10.0 10.3 10.3
M&S pro
d
ucts
2013/14 57%
6
4
%
2020 target 100%
Plan A quality
Grow Group
revenue
Strong
cash
generation
Improve
product
sustainability
Increase
earnings
and returns
DIVIDEND
PER SHARE
Dividend per share declared in respect
of the year.
The Board is recommending a fi nal
dividend of 11.6p per share, resulting
in a to t al divide n d of 18. 0 p, 1. 0p ab ove
last year.
18.0p
+1.0p
S
A
A
A