Marks and Spencer 2015 Annual Report Download - page 19
Download and view the complete annual report
Please find page 19 of the 2015 Marks and Spencer annual report below. You can navigate through the pages in the report by either clicking on the pages listed below, or by using the keyword search tool below to find specific information within the annual report.-
 1
1 -
2
-
3
-
4
-
5
-
6
-
7
-
8
-
 9
9 -
 10
10 -
 11
11 -
 12
12 -
 13
13 -
 14
14 -
 15
15 -
 16
16 -
 17
17 -
 18
18 -
 19
19 -
 20
20 -
 21
21 -
 22
22 -
 23
23 -
 24
24 -
 25
25 -
 26
26 -
 27
27 -
 28
28 -
 29
29 -
30
-
31
-
32
-
33
-
34
-
35
-
36
-
37
-
38
-
39
-
40
-
41
-
42
-
43
-
44
-
45
-
46
-
47
-
48
-
49
-
50
-
51
-
52
-
53
-
54
-
55
-
56
-
57
-
58
-
59
-
60
-
61
-
62
-
63
-
64
-
65
-
66
-
67
-
68
-
69
-
70
-
71
-
72
-
73
-
74
-
75
-
76
-
77
-
78
-
79
-
80
-
81
-
82
-
83
-
84
-
85
-
86
-
87
-
88
-
89
-
90
-
91
-
92
-
93
-
94
-
95
-
96
-
97
-
98
-
99
-
100
-
101
-
102
-
103
-
104
-
105
-
106
-
107
-
108
-
109
-
110
-
111
-
112
-
113
-
114
-
115
-
116
-
117
-
118
-
119
-
120
-
121
-
122
-
123
-
124
-
125
-
126
-
127
-
128
-
129
-
130
-
131
-
132
 |
 |

GOVERNANCEFINANCIAL STATEMENTS OUR PERFORMANCE OUR BUSINESS
17
ANNUAL REPORT AND FINANCIAL STATEMENTS 2015
INVESTING IN OUR INFRASTRUCTURE
Investment to make our supply chain fi t
for the future continued with a focus on our
GM IT systems and logistics network. Upon
completion, these two interdependent
projects will deliver greater supply chain
fl exibility and better availability for our
customers. In IT, we completed the
Allocation & Replenishment element of
our GM4 programme, implementing a new
stock distribution system that allocates
stock to stores based on demand, ensuring
our customers can get the products they
want in the location in which they want
them. In logistics, we continue to reshape
our GM warehouse network, and the
next milestone will be the launch of our
redeveloped Bradford National Distribution
Centre in 2016.
MANAGING OUR PROPERTY PORTFOLIO
We added 1.5% of UK selling space, driven
by our Simply Food growth programme. We
opened 67 new stores this year, including
62 Simply Food stores. We closed 13 stores,
of which fi ve were relocations, as we
continue to reshape our portfolio to ensure
that our stores are in the most convenient
locations. We expect Food space to
increase by 4.5% in 2015/16, again driven
by growth in Simply Food store numbers.
Our strategy is for GM space to remain fl at,
although we will continue to manage our
estate to improve the quality of stores for
our customers.
SUSTAINABLE REPORTING A
Our commitment to Plan A drives us to run
our business e ciently. An e ective,
sustainable business plan ultimately
delivers value for shareholders. Investors
recognise the long-term value of sourcing
responsibly, cutting waste and using
resources e ciently.
As members of the International Integrated
Reporting Council and the Prince’s
Accounting for Sustainability project (A4S),
we are committed to reporting the long-
term value created by sustainable business.
We have participated in projects supporting
natural capital accounting, and we are
taking part in the development of natural
capital protocols led by the Natural Capital
coalition, with the results due in 2016.
We are committed to managing and
reporting our global tax a airs in keeping
with our longstanding values and paying
our fair share of tax. There is further detail
on our tax contribution on page 18.
FIND OUT MORE
Read about Our operating performance on p26-31 See how performance links to Remuneration on p62
See Our plan and Strategic priorities on p08-13
See our Key performance indicators on p14-15
52 weeks ended
28 Mar 15
£m
29 Mar 14
£m % var
Group revenue110,311.4 10,309.7 Level
UK 9,223.1 9,155.7 +0.7
International11,088.3 1,154.0 -5.7
Underlying operating profi t 762.5 741.9 +2. 8
UK 670.2 619.2 +8.2
International 92.3 12 2.7 -24 . 8
Underlying profi t before tax 661.2 622.9 +6.1
Non-underlying items (61.2) (42.5) -44.0
Profi t before tax 600.0 580.4 +3.4
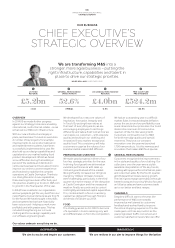
Underlying basic earnings per share 33.1p 32.2p +2.8
Basic earnings per share 29.7p 32.5p -8.6
Dividend per share (declared) 18.0p 17. 0 p
1. On reported currency basis.
SUMMARY OF RESULTS