KeyBank 2011 Annual Report Download - page 12
Download and view the complete annual report
Please find page 12 of the 2011 KeyBank annual report below. You can navigate through the pages in the report by either clicking on the pages listed below, or by using the keyword search tool below to find specific information within the annual report.-
 1
1 -
 2
2 -
 3
3 -
 4
4 -
 5
5 -
 6
6 -
 7
7 -
 8
8 -
 9
9 -
 10
10 -
 11
11 -
 12
12 -
 13
13 -
 14
14 -
 15
15 -
 16
16 -
 17
17 -
 18
18 -
 19
19 -
 20
20 -
 21
21 -
 22
22 -
23
-
24
-
25
-
26
-
27
-
28
 |
 |

10
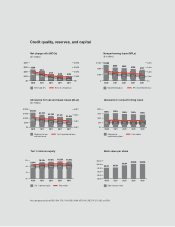
Five-year financial highlights
dollars in millions, except per share amounts 2011 2010 2009 2008 2007
YEAR ENDED DECEMBER 31,
Total revenue (TE) $ 4,100 $ 4,491 $ 4,441 $ 3,709 $ 5,026
Noninterest expense 2,790 3,034 3,554 3,476 3,158
Provision for loan losses (60) 638 3,159 1,537 525
Income (loss) from continuing operations attributable to Key 964 577 (1,287) (1,295) 935
Income (loss) from discontinued operations, net of taxes (44) (23) (48) (173) (16)
Net income (loss) attributable to Key 920 554 (1,335) (1,468) 919
Income (loss) from continuing operations attributable
to Key common shareholders 857 413 (1,581) (1,337) 935
Net income (loss) attributable to Key common shareholders 813 390 (1,629) (1,510) 919
PER COMMON SHARE
Income (loss) from continuing operations attributable
to Key common shareholders $ .92 $ .47 $ (2.27) $ (2.97) $ 2.39
Income (loss) from discontinued operations, net of taxes (.05) (.03) (.07) (.38) (.04)
Net income (loss) attributable to Key common shareholders .87 .45 (2.34) (3.36) 2.35
Income (loss) from continuing operations attributable
to Key common shareholders – assuming dilution .92 .47 (2.27) (2.97) 2.36
Income (loss) from discontinued operations, net of taxes
– assuming dilution (.05) (.03) (.07) (.38) (.04)
Net income (loss) attributable to Key common shareholders
– assuming dilution .87 .44 (2.34) (3.36) 2.32
Cash dividends paid $ .10 $ .04 $ .09 $ 1.00 $ 1.46
Book value at year end 10.09 9.52 9.04 14.97 19.92
Tangible book value at year end 9.11 8.45 7.94 12.48 16.47
Market price at year end 7.69 8.85 5.55 8.52 23.45
Weighted-average common shares (000) 931,934 874,748 697,155 450,039 392,013
Weighted-average common shares
and potential common shares (000) 935,801 878,153 697,155 450,039 395,823
AT DECEMBER 31,
Loans $ 49,575 $ 50,107 $ 58,770 $ 72,835 $ 70,492
Earning assets 73,729 76,211 80,318 89,759 82,865
Total assets 88,785 91,843 93,287 104,531 98,228
Deposits 61,956 60,610 65,571 65,127 62,934
Key shareholders’ equity 9,905 11,117 10,6 6 3 10,4 8 0 7,746
Common shares outstanding (000) 953,008 880,608 878,535 495,002 388,793
PERFORMANCE RATIOS
From continuing operations:
Return on average total assets 1.17% .66% (1.35)% (1.29)% 1.02%
Return on average common equity 9.26 5.06 (19.00) (16.22) 12.11
Net interest margin (TE) 3.16 3.26 2.83 2.15 3.50
From consolidated operations:
Return on average total assets 1.04% .59% (1.34)% (1.41)% .97%
Return on average common equity 8.79 4.78 (19.62) (18.32) 11.90
Net interest margin (TE) 3.09 3.16 2.81 2.16 3.46
CAPITAL RATIOS
Key shareholders’ equity to assets 11.16% 12.10% 11.43% 10.03% 7.89%
Tangible common equity to tangible assets 9.88 8.19 7.56 5.98 6.61
Tier 1 risk-based capital 12.99 15.16 12.75 10.92 7.44
Tier 1 common equity 11.26 9.34 7.50 5.62 5.74
Total risk-based capital 16.51 19.12 16.95 14.82 11.38
TE = Taxable Equivalent