KeyBank 2011 Annual Report Download - page 10
Download and view the complete annual report
Please find page 10 of the 2011 KeyBank annual report below. You can navigate through the pages in the report by either clicking on the pages listed below, or by using the keyword search tool below to find specific information within the annual report.-
 1
1 -
 2
2 -
 3
3 -
 4
4 -
 5
5 -
 6
6 -
 7
7 -
 8
8 -
 9
9 -
 10
10 -
 11
11 -
 12
12 -
 13
13 -
 14
14 -
 15
15 -
 16
16 -
 17
17 -
 18
18 -
 19
19 -
 20
20 -
 21
21 -
22
-
23
-
24
-
25
-
26
-
27
-
28
 |
 |

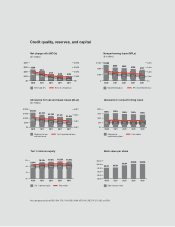
Credit quality, reserves, and capital
$0
$100
$200
$300
$400
$193
$134 $109 $105
$256
4Q10 1Q11 2Q11 3Q11 4 Q11
4.00%
3.00%
2.00%
1.00%
0%
2.00%
1.59%
1.11% .90% .86%
Net charge-offs (NCOs)
($ in millions)
Net charge-offs NCOs to average loans
$0
$500
$1,000
$1,500
$2,000
$1,372 $1,230 $1,131 $1,004
$1,604
4Q10 1Q11 2Q11 3Q11 4 Q11
6.00%
0.00%
3.20% 2.83% 2.57% 2.35% 2.03%
Allowance for loan and lease losses (ALLL)
($ in millions)
Allowance for loan
and lease losses
ALLL to period-end loans
2.00%
4.00%
0%
1.00%
2.00%
3.00%
4.00%
$885 $842 $788 $727
$1,068
4Q10 1Q11 2Q11 3Q11 4 Q11
$1,200
0
2.13% 1.82% 1.76% 1.64% 1.47%
Nonperforming loans (NPLs)
($ in millions)
Nonperforming loans NPLs to period-end loans
$400
$800
0%
12%
8%
4%
10.74% 11.14% 11.28% 11.26%
9.34%
4Q10 1Q11 2Q11 3Q11 4 Q11
Tier 1 common equity
Tier 1 common equity Peer median
9.07% 9.32% 9.58% 9.78% 9.63%
$8.00
$8.50
$9.00
$9.50
$10.50
$9.58
$9.88 $10.09 $10.09
$9.52
4Q10 1Q11 2Q11 3Q11 4 Q11
Book value per share
Book value per share
$10.00
0%
50%
100%
150%
200%
155% 146% 144% 138%
150%
4Q10 1Q11 2Q11 3Q11 4 Q11
Allowance to nonperforming loans
Allowance to
nonperforming loans
75% 76% 75% 73% 74%
Peer median
Key’s peer group consists of: BBT, CMA, FITB, FHN, HCBK, HBAN, MTB, PNC, PBCT, RF, STI, USB, and ZION.