John Deere 2013 Annual Report Download - page 3
Download and view the complete annual report
Please find page 3 of the 2013 John Deere annual report below. You can navigate through the pages in the report by either clicking on the pages listed below, or by using the keyword search tool below to find specific information within the annual report.-
 1
1 -
 2
2 -
 3
3 -
 4
4 -
 5
5 -
 6
6 -
 7
7 -
 8
8 -
 9
9 -
 10
10 -
 11
11 -
 12
12 -
 13
13 -
 14
14 -
15
-
16
-
17
-
18
-
19
-
20
-
21
-
22
-
23
-
24
-
25
-
26
-
27
-
28
-
29
-
30
-
31
-
32
-
33
-
34
-
35
-
36
-
37
-
38
-
39
-
40
-
41
-
42
-
43
-
44
-
45
-
46
-
47
-
48
-
49
-
50
-
51
-
52
-
53
-
54
-
55
-
56
-
57
-
58
-
59
-
60
-
61
-
62
-
63
-
64
 |
 |

3
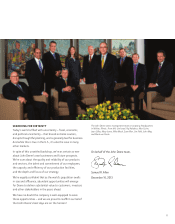
EYES ON THE HORIZON
More than 9 Billion:
Estimated worldwide population by 2050
70% living in cities
Target: $50 Billion in Mid-Cycle SalesCapital Expenditures + Research & Development
(in billions)
Experts project that the world’s expanding and
increasingly urban population will enjoy higher living
VWDQGDUGVDQGGLHWVZLWKPRUHJUDLQLQWHQVLYH
foods such as meat. In response, Deere will
be called on to offer products and services that
help meet the demand for vastly more food, fuel,
shelter and infrastructure in the years ahead.
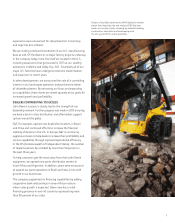
Keeping our “eyes on the horizon,” carrying out
our ambitious growth plans, requires an
extensive investment in new products and
capacity. Seven new factories in markets key
to our growth were completed in 2013.
In 2010, Deere set an ambitious goal: to reach
ELOOLRQLQVDOHVDWPLGF\FOHYROXPHV
E\ZKLOHLPSURYLQJSURƟWDELOLW\
Net sales have increased nearly
50% since the baseline year.
R&D Spending $1. 2 $1.4 $ 1.5
2011 2012 2013
$2.3 $2.8 $2.6
$1.1 $1.4 $1.1
C
apita
l
Expen
d
iture
s
20502010
70%
2018
$50 B
2010 2011 2012 2013
Net Sales (actual)