John Deere 2013 Annual Report Download - page 15
Download and view the complete annual report
Please find page 15 of the 2013 John Deere annual report below. You can navigate through the pages in the report by either clicking on the pages listed below, or by using the keyword search tool below to find specific information within the annual report.-
 1
1 -
2
-
3
-
4
-
 5
5 -
 6
6 -
 7
7 -
 8
8 -
 9
9 -
 10
10 -
 11
11 -
 12
12 -
 13
13 -
 14
14 -
 15
15 -
 16
16 -
 17
17 -
 18
18 -
 19
19 -
 20
20 -
 21
21 -
 22
22 -
 23
23 -
 24
24 -
 25
25 -
26
-
27
-
28
-
29
-
30
-
31
-
32
-
33
-
34
-
35
-
36
-
37
-
38
-
39
-
40
-
41
-
42
-
43
-
44
-
45
-
46
-
47
-
48
-
49
-
50
-
51
-
52
-
53
-
54
-
55
-
56
-
57
-
58
-
59
-
60
-
61
-
62
-
63
-
64
 |
 |

15
MANAGEMENT’S DISCUSSION AND ANALYSIS
RESULTS OF OPERATIONS FOR THE YEARS ENDED
OCTOBER 31, 2013, 2012 AND 2011
OVERVIEW
Organization
The company’s equipment operations generate revenues and
cash primarily from the sale of equipment to John Deere dealers
and distributors. The equipment operations manufacture and
distribute a full line of agricultural equipment; a variety of
commercial, consumer and landscapes equipment and products;
and a broad range of equipment for construction and forestry.
The company’s financial services primarily provide credit
services, which mainly finance sales and leases of equipment by
John Deere dealers and trade receivables purchased from the
equipment operations. In addition, financial services offer crop
risk mitigation products and extended equipment warranties.
The information in the following discussion is presented in a
format that includes information grouped as consolidated,
equipment operations and financial services. The company
also views its operations as consisting of two geographic areas,
the U.S. and Canada, and outside the U.S. and Canada.
The company’s operating segments consist of agriculture and
turf, construction and forestry, and financial services.
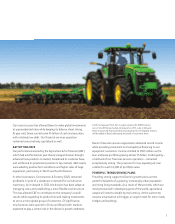
Trends and Economic Conditions
The company’s agriculture and turf equipment sales increased
7 percent in 2013 and are forecast to decrease by about 6
percent for 2014. Industry agricultural machinery sales in the
U.S. and Canada for 2014 are forecast to decrease 5 to 10
percent, compared to 2013. Industry sales in the European
Union (EU)28 nations are forecast to decrease about 5 percent
in 2014, while South American industry sales are projected to
decrease 5 to 10 percent from strong 2013 levels. Industry sales
in the Commonwealth of Independent States are expected to
decrease slightly, while sales in Asia are forecast to increase
slightly in 2014. Industry sales of turf and utility equipment in
the U.S. and Canada are expected to increase approximately
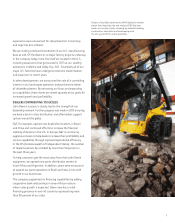
5 percent. The company’s construction and forestry sales
decreased 8 percent in 2013 and are forecast to increase by
about 10 percent in 2014. Sales in world forestry markets are
expected to increase in 2014. Net income of the company’s
financial services operations attributable to Deere & Company
in 2014 is expected to be approximately $600 million.
Items of concern include the uncertainty of the effective-
ness of governmental actions in respect to monetary and fiscal
policies, the global economic recovery, the impact of sovereign
and state debt, eurozone issues, capital market disruptions and
trade agreements. Significant volatility in the price of many
commodities could also impact the company’s results.
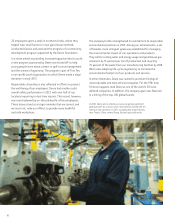
Designing and producing products with engines that continue
to meet high performance standards and increasingly stringent
emissions regulations is one of the company’s major priorities.
The company believes its plans for helping meet the
world’s need for food, shelter and infrastructure are firmly on
track. The company’s financial results have generated healthy
levels of cash flow, which have been used to fund global
growth and provide direct benefit to investors through divi-
dends and share repurchases.
2013 COMPARED WITH 2012
CONSOLIDATED RESULTS
Worldwide net income attributable to Deere & Company in
2013 was $3,537 million, or $9.09 per share diluted ($9.18 basic),
compared with $3,065 million, or $7.63 per share diluted
($7.72 basic), in 2012. Net sales and revenues increased
5 percent to $37,795 million in 2013, compared with $36,157
million in 2012. Net sales of the equipment operations
increased 4 percent in 2013 to $34,998 million from $33,501
million last year. The sales increase included improved price
realization of 3 percent and an unfavorable foreign currency
translation effect of 1 percent. Net sales in the U.S. and Canada
increased 5 percent in 2013. Net sales outside the U.S. and
Canada increased by 4 percent in 2013, which included an
unfavorable effect of 3 percent for foreign currency translation.
Worldwide equipment operations had an operating profit
of $5,058 million in 2013, compared with $4,397 million in
2012. The higher operating profit was primarily due to the
impact of improved price realization and higher shipment
volumes, partially offset by the unfavorable effects of foreign
currency exchange, increased production costs, higher selling,
administrative and general expenses and increased warranty
costs. The increased production costs were due primarily to
higher manufacturing overhead expenses in support of growth,
new products and engine emission requirements, partially
offset by lower raw material costs. The results were also
affected by impairment charges for long-lived assets related to
the Water operations and a write down to realizable value of
the assets being held for sale for the Landscapes operations
(see Notes 4 and 5).
The equipment operations’ net income was $2,974 million
in 2013, compared with $2,616 million in 2012. The same
operating factors mentioned above, as well as an increase in
interest expense due to higher average borrowings and a higher
effective tax rate affected these results.
Net income of the financial services operations attribut-
able to Deere & Company in 2013 increased to $565 million,
compared with $460 million in 2012. The results were higher
primarily due to growth in the credit portfolio and higher crop
insurance margins, partially offset by higher selling, administrative
and general expenses. In addition, last year’s results benefited
from revenue related to wind energy credits. Additional infor-
mation is presented in the following discussion of the
“Worldwide Financial Services Operations.”
The cost of sales to net sales ratio for 2013 was 73.3 percent,
compared with 74.6 percent last year. The improvement was
primarily due to the increase in price realization, partially offset
by the unfavorable effects of foreign currency exchange, higher
production costs and increased warranty costs.