JP Morgan Chase 2006 Annual Report Download - page 3
Download and view the complete annual report
Please find page 3 of the 2006 JP Morgan Chase annual report below. You can navigate through the pages in the report by either clicking on the pages listed below, or by using the keyword search tool below to find specific information within the annual report.-
 1
1 -
 2
2 -
 3
3 -
 4
4 -
 5
5 -
 6
6 -
 7
7 -
 8
8 -
 9
9 -
 10
10 -
 11
11 -
 12
12 -
 13
13 -
 14
14 -
15
-
16
-
17
-
18
-
19
-
20
-
21
-
22
-
23
-
24
-
25
-
26
-
27
-
28
-
29
-
30
-
31
-
32
-
33
-
34
-
35
-
36
-
37
-
38
-
39
-
40
-
41
-
42
-
43
-
44
-
45
-
46
-
47
-
48
-
49
-
50
-
51
-
52
-
53
-
54
-
55
-
56
-
57
-
58
-
59
-
60
-
61
-
62
-
63
-
64
-
65
-
66
-
67
-
68
-
69
-
70
-
71
-
72
-
73
-
74
-
75
-
76
-
77
-
78
-
79
-
80
-
81
-
82
-
83
-
84
-
85
-
86
-
87
-
88
-
89
-
90
-
91
-
92
-
93
-
94
-
95
-
96
-
97
-
98
-
99
-
100
-
101
-
102
-
103
-
104
-
105
-
106
-
107
-
108
-
109
-
110
-
111
-
112
-
113
-
114
-
115
-
116
-
117
-
118
-
119
-
120
-
121
-
122
-
123
-
124
-
125
-
126
-
127
-
128
-
129
-
130
-
131
-
132
-
133
-
134
-
135
-
136
-
137
-
138
-
139
-
140
-
141
-
142
-
143
-
144
-
145
-
146
-
147
-
148
-
149
-
150
-
151
-
152
-
153
-
154
-
155
-
156
 |
 |

50
55
60
65
$70
45
40
2004 2005 2006
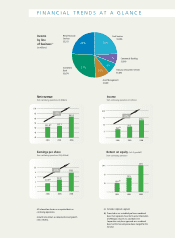
$51.8(b) $53.7
$61.4
9%
10
15
20%
2004 2005 2006
10%(b)
13%
20%
1
2
3
4
$5
2004 2005 2006
$1.75(b) $2.32
$3.82
48%
5
10
15
$20
2004 2005 2006
$6.3(b) $8.3
$13.6
47%
Net revenue
from continuing operations (in billions)
Income
from continuing operations (in billions)
Return on equity (net of goodwill)
from continuing operations
Earnings per share
from continuing operations (fully diluted)
FINANCIAL TRENDS AT A GLANCE
(a) Excludes Corporate segment
(b) Presented on an unaudited pro forma combined
basis that represents how the financial information
of JPMorgan Chase & Co. and Bank One
Corporation may have appeared on a combined
basis had the two companies been merged for the
full year.
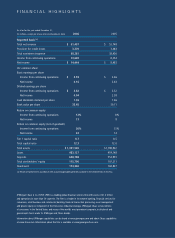
Income
by line
of business(a)
(in millions)
Commercial Banking
$1,010
Investment
Bank
$3,674
Retail Financial
Services
$3,213
Card Services
$3,206
Asset Management
$1,409
Treasury & Securities Services
$1,090
All information shown on a reported basis on
continuing operations.
Growth rates shown as compound annual growth
rates (CAGRs).
27%
24%
24%
7%
8%
10%