JP Morgan Chase 2006 Annual Report Download - page 12
Download and view the complete annual report
Please find page 12 of the 2006 JP Morgan Chase annual report below. You can navigate through the pages in the report by either clicking on the pages listed below, or by using the keyword search tool below to find specific information within the annual report.
10
Here are some specific risk issues:
Challenges in the credit world
We continuously analyze and measure our risk. In fact,
during budget planning, we ask our management teams
to prepare – on all levels – for difficult operating envi-
ronments. While the risk comes in many forms, such as
recession, market turmoil and geopolitical turbulence,
one of our largest risks is still the credit cycle. Credit
losses, both consumer and wholesale, have been extreme-
ly low, perhaps among the best we’ll see in our lifetimes.
We must be prepared for a return to the norm in the
credit cycle.
The chart below shows a rough estimate of what could
happen to credit costs over the business cycle – provided
we do a good and disciplined job underwriting credit.
In a tougher credit environment, credit losses could rise
significantly, by as much as $5 billion over time, which
may require increases in loan loss reserves. Investment
Bank revenue could drop, and the yield curve could
sharply invert. This could have a significant negative
effect on JPMorgan Chase’s earnings. That said, these
events generally do not occur simultaneously, and there
would be normal mitigating factors for our earnings
(e.g., compensation pools likely would go down, some
customer fees and spreads would probably go up, and
funding costs could decrease).
It’s important to share these numbers with you, not to
worry you, but to be as transparent as possible about the
potential impact of these negative scenarios and to let you
know how we are preparing for them. We do not know
exactly what will occur or when, but we do know that bad
things happen. There is no question that our company’s
earnings could go down substantially. But if we are pre-
pared, we can both minimize the damage to our company
and capitalize on opportunities in the marketplace.
Subprime mortgages: the good, the bad and possibly
the ugly
THE GOOD
We did a lot of things right:
• We did not originate option ARMs or other negative
amortization loans.
• We applied the same underwriting standards to all
of our subprime loans, whether originated by us or
purchased from third parties.
• We sold substantially all of our 2006 subprime origina-
tions. (We underwrite all of our subprime loans to be
held; in fact, we prefer to hold and service these mort-
gages, but prices at the time of sale were too good to
pass up.)
• We were very careful in certain parts of the United
States and were especially careful to seek accurate
property appraisals.
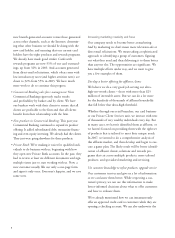
Annual potential net charge-off rates by business
ACTUAL ESTIMATED
2006 THROUGH CYCLE
Investment Bank (0.05%) 1.00%
Commercial Banking 0.05% 0.50%
Card Services 3.33% 5.00%
Retail Financial Services
Home Equity 0.18% 0.30%
Home Lending 0.12% 0.42%
Prime Mortgage
0.04% 0.08%
Subprime Mortgage
0.31% 1.00%
Auto Finance 0.56% 0.75%
Business Banking 0.69% 1.30%


