International Paper 2015 Annual Report Download - page 5
Download and view the complete annual report
Please find page 5 of the 2015 International Paper annual report below. You can navigate through the pages in the report by either clicking on the pages listed below, or by using the keyword search tool below to find specific information within the annual report.-
 1
1 -
 2
2 -
 3
3 -
 4
4 -
 5
5 -
 6
6 -
 7
7 -
 8
8 -
 9
9 -
 10
10 -
 11
11 -
 12
12 -
 13
13 -
 14
14 -
 15
15 -
 16
16 -
17
-
18
-
19
-
20
-
21
-
22
-
23
-
24
-
25
-
26
-
27
-
28
-
29
-
30
-
31
-
32
-
33
-
34
-
35
-
36
-
37
-
38
-
39
-
40
-
41
-
42
-
43
-
44
-
45
-
46
-
47
-
48
-
49
-
50
-
51
-
52
-
53
-
54
-
55
-
56
-
57
-
58
-
59
-
60
-
61
-
62
-
63
-
64
-
65
-
66
-
67
-
68
-
69
-
70
-
71
-
72
-
73
-
74
-
75
-
76
-
77
-
78
-
79
-
80
-
81
-
82
-
83
-
84
-
85
-
86
-
87
-
88
-
89
-
90
-
91
-
92
-
93
-
94
-
95
-
96
-
97
-
98
-
99
-
100
-
101
-
102
-
103
-
104
-
105
-
106
-
107
-
108
-
109
-
110
-
111
-
112
-
113
-
114
-
115
-
116
-
117
 |
 |

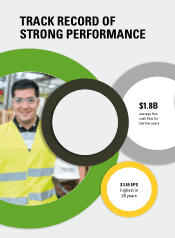
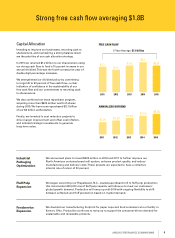
Strong free cash flow averaging $1.8B
Capital Allocation
Investing to improve our businesses, returning cash to
shareowners, and maintaining a strong balance sheet
are the priorities of our cash allocation strategy.
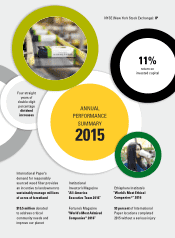
In 2015 we returned $1.2 billion to our shareowners using
our strong cash flow to fund a 10 percent increase in our
annual dividend. This was the fourth consecutive year of
double-digit percentage increases.
We strengthened our dividend policy by committing
to target 40 to 50 percent of free cash flow—a clear
indication of confidence in the sustainability of our
free cash flow and our commitment to returning cash
to shareowners.
We also continued our stock repurchase program,
acquiring more than $500 million worth of shares
during 2015. We have now repurchased $2.1 billion
of our $3 billion authorization.
Finally, we invested in cost reduction projects to
drive margin improvement and offset cost inflation,
and initiated strategic investments to generate
long-term value.
FREE CASH FLOW
5-Year Average: $1.8 billion
$1.8
2013
$1.6
2012
$1.7
2011
$2.1
2014
$1.8
2015
ANNUALIZED DIVIDEND
2011
$1.05 $1.20 $1.40 $1.60 $1.76
2012 2013 2014 2015
We announced plans to invest $300 million in 2016 and 2017 to further improve our
North American containerboard mill system, enhance product quality, and reduce
manufacturing and delivery costs. These projects are expected to have a collective
internal rate of return of 20 percent.
Industrial
Packaging
Optimization
We began converting our Riegelwood, N.C., coated paperboard mill to fluff pulp production;
this incremental 400,000 tons of fluff pulp capacity will allow us to meet our customers’
global growth demand. Production will ramp up mid-2016 with ongoing flexibility to shift
between softwood and fluff production based on market demand.
Fluff Pulp
Expansion
We doubled our manufacturing footprint for paper cups and food containers at our facility in
Kenton, Ohio. Production continues to ramp up to support the consumer-driven demand for
sustainable and renewable products.
Foodservice
Expansion
ANNUAL PERFORMANCE SUMMARY 2015 4