Intel 2001 Annual Report Download - page 37
Download and view the complete annual report
Please find page 37 of the 2001 Intel annual report below. You can navigate through the pages in the report by either clicking on the pages listed below, or by using the keyword search tool below to find specific information within the annual report.-
 1
1 -
2
-
3
-
4
-
5
-
6
-
7
-
8
-
9
-
10
-
11
-
12
-
13
-
14
-
15
-
16
-
17
-
18
-
19
-
20
-
21
-
22
-
23
-
24
-
25
-
26
-
 27
27 -
 28
28 -
 29
29 -
 30
30 -
 31
31 -
 32
32 -
 33
33 -
 34
34 -
 35
35 -
 36
36 -
 37
37 -
 38
38 -
 39
39 -
 40
40 -
 41
41 -
 42
42 -
 43
43 -
 44
44 -
 45
45 -
 46
46 -
 47
47 -
48
-
49
-
50
-
51
-
52
-
53
-
54
-
55
-
56
-
57
-
58
-
59
-
60
-
61
-
62
 |
 |

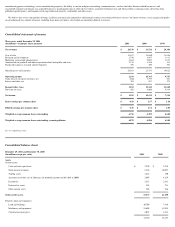
of financial condition and results of operations
Results of operations
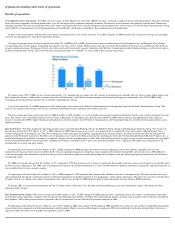
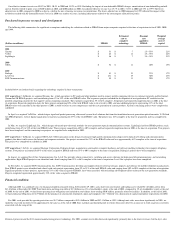
Consolidated revenues and margin > For 2001, our net revenues of $26.5 billion were 21% below 2000 net revenues, reflecting a tough year for the technology industry. Revenues declined
across all of our geographies and major product lines as we felt the impact of the worldwide economic slowdown. Our decrease in net revenues came primarily from the Intel Architecture
operating segment in the form of significantly lower unit volumes and significantly lower average selling prices of microprocessors. Lower revenues in both the Intel Communications Group
and the Wireless Communications and Computing Group also contributed to the decline as demand for these products decreased significantly.
In spite of the revenue decline and the lower sales volume of microprocessors, cost of sales increased 7% in 2001 compared to 2000, primarily due to increased start-up costs and higher
unit costs for microprocessors in the Intel Architecture business.
Our gross margin percentage decreased significantly, from 62% in 2000 to 49% in 2001, primarily due to lower revenues from sales of microprocessors, including the effect of lower
average selling prices and the impact of spreading fixed factory costs over a lower volume. Higher factory start-up costs for the Intel Architecture business also contributed to the decline in
the gross margin percentage. The impact of lower sales volume and a decline in factory capacity utilization in the Wireless Communications and Computing Group, as well as lower sales in
the Intel Communications Group, also lowered the gross margin percentage. See "Outlook" for a discussion of gross margin expectations.
By contrast, from 1999 to 2000, our net revenues increased by 15%, primarily due to a higher unit sales volume of microprocessors, partially offset by lower average selling prices in the
Intel Architecture business. Additionally, revenues from sales of flash memory in the Wireless Communications and Computing Group grew significantly from 1999 to 2000, as did
networking and communications product sales in the Intel Communications Group.
Cost of sales increased 7% in 2000 compared to 1999, due to higher sales volume in the Wireless Communications and Computing Group and the Intel Communications Group. This
increase was partially offset by lower cost of sales in the Intel Architecture business, primarily due to lower unit costs.
The gross margin percentage increased to 62% in 2000 from 60% in 1999, primarily as a result of higher gross margin in the Intel Architecture business due to lower microprocessor unit
costs. These lower costs were partially offset by lower average selling prices for microprocessors and the costs recorded in 2000 related to chipsets and motherboards with a defective
memory translator hub (MTH). Improved demand and higher prices for flash memory in the Wireless Communications and Computing Group also contributed to the improvement in gross
margin percentage.
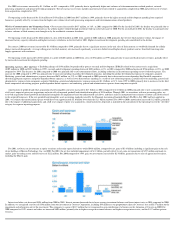
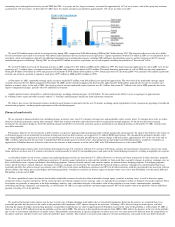
Intel Architecture >
The Intel Architecture operating segment consists of the Desktop Platforms Group, the Mobile Platforms Group and the Enterprise Platforms Group. Net revenues for
this business decreased by $5.9 billion, or 21%, in 2001 compared to 2000. The decrease in net revenues was primarily due to significantly lower unit volumes and significantly lower
average selling prices of microprocessors. The lower selling prices reflect the impact of competitive pricing pressures and our strategy to accelerate the transition from the Pentium® III
processor to the Pentium® 4 processor. For 2001, sales of microprocessors based on the P6 microarchitecture (including the Celeron®, Pentium III and Pentium® III Xeon™ processors), as
well as related board-level products and chipsets, comprised a majority of our consolidated net revenues and a substantial majority of our gross margin. For the same period, sales of products
based on the Intel® NetBurst™ microarchitecture, including the Pentium 4 and Intel® Xeon™ processors and related products, were a significant and rapidly increasing portion of our
consolidated net revenues and gross margin.
Net operating results decreased by $6.3 billion, or 50%, in 2001 compared to 2000, primarily due to lower average selling prices, lower unit volumes and higher unit costs for
microprocessors. Increased start-up costs related to the 0.13-micron manufacturing process technology, which ramped in four factories during 2001, and start-up costs on 300-millimeter
wafer manufacturing also contributed to the decline. Lower revenue-dependent expenses and reduced spending due to company-wide cost reduction programs partially offset the decline in
net operating results.
For 2000, net revenues increased by $1.8 billion, or 7%, compared to 1999. The increase in net revenues was primarily due to higher unit sales volume of microprocessors, partially offset
by lower average selling prices. For 2000, sales of microprocessors based on the P6 microarchitecture, as well as related board-
level products and chipsets comprised a substantial majority of
our consolidated net revenues and gross margin.
Net operating results increased by $1.4 billion, or 12%, in 2000 compared to 1999, primarily due to higher sales and lower unit costs of microprocessors. The decreased unit costs were
achieved primarily through the continued transition to redesigned microprocessor products with lower cost packaging as well as factory efficiencies. The lower unit costs were partially offset
by higher costs due to a higher sales volume of microprocessors and the costs recorded in 2000 related to chipsets and motherboards with the defective MTH component.
In January 2002, we announced the promotion of Paul S. Otellini, who was Executive Vice President and General Manager of the Intel Architecture Group, to President and Chief
Operating Officer of Intel.
Intel Communications Group >
Net revenues decreased by $903 million, or 26%, in 2001 compared to 2000, primarily due to significantly lower unit volumes of embedded control chips,
network processing components, enterprise infrastructure and telecommunications products, including telecommunications boards, consistent with an industry-wide reduction in demand for
these products. The overall revenue decline was partially offset by incremental revenues related to acquisitions completed in 2001.
Net operating results decreased by $1.1 billion to a loss of $735 million in 2001 from a profit of $319 million in 2000, primarily due to the lower unit volumes of embedded control chips,
network processing components and telecommunications-related products. Higher research and development spending in 2001 also contributed to the decline, primarily due to businesses
acquired in 2001 and a full year of spending for acquisitions made in 2000.