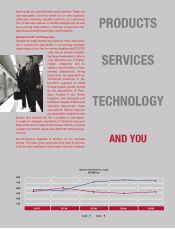
Ingram Micro 2008 Annual Report Download - page 4
Download and view the complete annual report
Please find page 4 of the 2008 Ingram Micro annual report below. You can navigate through the pages in the report by either clicking on the pages listed below, or by using the keyword search tool below to find specific information within the annual report.-
 1
1 -
 2
2 -
 3
3 -
 4
4 -
 5
5 -
 6
6 -
 7
7 -
 8
8 -
 9
9 -
 10
10 -
 11
11 -
 12
12 -
 13
13 -
 14
14 -
 15
15 -
16
-
17
-
18
-
19
-
20
-
21
-
22
-
23
-
24
-
25
-
26
-
27
-
28
-
29
-
30
-
31
-
32
-
33
-
34
-
35
-
36
-
37
-
38
-
39
-
40
-
41
-
42
-
43
-
44
-
45
-
46
-
47
-
48
-
49
-
50
-
51
-
52
-
53
-
54
-
55
-
56
-
57
-
58
-
59
-
60
-
61
-
62
-
63
-
64
-
65
-
66
-
67
-
68
-
69
-
70
-
71
-
72
-
73
-
74
-
75
-
76
-
77
-
78
-
79
-
80
-
81
-
82
-
83
-
84
-
85
-
86
-
87
-
88
-
89
-
90
-
91
-
92
-
93
-
94
-
95
-
96
-
97
-
98
-
99
-
100
 |
 |

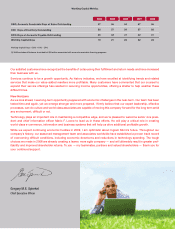
Progress on gross margins and operating costs in 2008
would not be sufficient given the significant downturn the
IT sector experienced coming into the new year. In early
2009, we announced further restructuring actions,
primarily in North America and Europe, which are
expected to yield additional annual savings of $100
million to $120 million by the end of the year. North
America is expected to generate a majority of these
savings through optimization efforts to reduce overhead
and restructure certain business units and facilities. The
European region is taking similar actions, including the
re-positioning of its Nordic
operations, whereby we intend
to sell our Danish operations and
exit those in Norway and
Finland. The Asia-Pacific and
Latin American regions are also
participating in this plan to
rationalize their expense struc-
tures in line with the decline
in revenues.
Step by step, we worked meticu-
lously to improve our profitability.
Even so, like many companies,
the volatile equity environment in
2008 negatively impacted our
market capitalization, triggering a
pre-tax goodwill impairment charge of $743 million in the
fourth quarter. Absent that charge, our hard work and
ingenuity enabled us to close the year with a respectable
operating margin. The underlying operating performance
of the company combined with our world-class balance
sheet puts us in a strong position relative to many sectors
in this economy. As the markets recover from the current
downturn, we feel we are well positioned with our
customers and vendors to take advantage of consolida-
tion opportunities this economy might present.
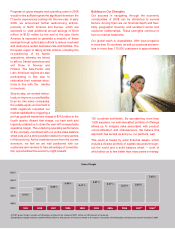
Building on Our Strengths
Our success in navigating through the economic
complexities of 2008 can be attributed to several
factors. Among them are our financial depth and flexi-
bility, geographic diversity, and excellent vendor and
customer relationships. These strengths continue to
fuel our market leadership.
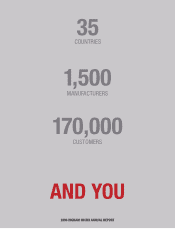
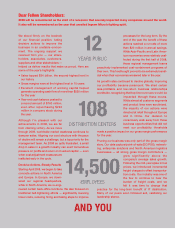
Our global reach is unparalleled. With local presence
in more than 30 countries, we sell our products and serv-
ices to more than 170,000 customers in approximately
150 countries worldwide. By representing more than
1,500 suppliers, our well-diversified portfolio of offerings
allows us to mitigate risks associated with product
commoditization and obsolescence. We believe this
approach has served us and you, our partners, well.
This reach is fueled by solid financial assets, which
include a diverse portfolio of capital resources through-
out the world and a solid balance sheet — both of
which allow us to fare better than many peers in manag-
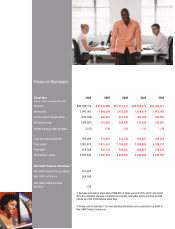
(1) 2007 gross margin includes net Brazilian commercial tax charge of $30.1 million or 0.09 percent of revenues.
(2) 2008 gross margin includes a benefit of $8.2 million or 0.02 percent of revenues related to the release of a portion of the Brazilian commercial tax reserve recorded in 2007.