Ingram Micro 1999 Annual Report Download - page 5
Download and view the complete annual report
Please find page 5 of the 1999 Ingram Micro annual report below. You can navigate through the pages in the report by either clicking on the pages listed below, or by using the keyword search tool below to find specific information within the annual report.-
 1
1 -
 2
2 -
 3
3 -
 4
4 -
 5
5 -
 6
6 -
 7
7 -
 8
8 -
 9
9 -
 10
10 -
 11
11 -
 12
12 -
 13
13 -
 14
14 -
 15
15 -
 16
16 -
17
-
18
-
19
-
20
-
21
-
22
-
23
-
24
-
25
-
26
-
27
-
28
-
29
-
30
-
31
-
32
-
33
-
34
-
35
-
36
-
37
-
38
-
39
-
40
-
41
-
42
-
43
-
44
-
45
-
46
-
47
-
48
-
49
-
50
-
51
-
52
-
53
-
54
-
55
-
56
 |
 |

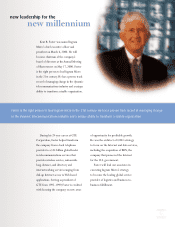
GTE Corporation.We have provided additional
information on Kent’s outstanding accomp-
lishments in a special section immediately
following this letter. It is a great pleasure to
introduce Kent to you, our shareowners.
Financial Results
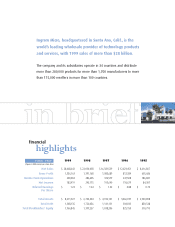
Demand for Ingram Micro’s broad product
offering and world-class logistics and fulfillment
services was solid in all regions of the world,
with significant increases in sales to Internet
retail storefronts and other e-commerce-driven
business markets.As a result, we achieved net
sales globally of $28.1 billion, growing 27
percent from 1998.We are significantly larger
than our next largest competitor and believe we
exited 1999 with No. 1 market share in each of
our major geographic regions.
Our teams around the world continue to
lead the industry with superior execution on
accuracy, timeliness and product availability,
while at the same time managing dramatic
increases in order volume.We achieved
impressive levels of customer service and
simultaneously increased productivity.We
lowered total operating costs prior to one-time
events to 4 percent of net sales, setting yet
another industry benchmark.
We accomplished these results despite a
250
200
150
100
50
0
$
‘98‘97‘96‘95 ‘99
difficult business environment. During 1999, we
experienced intensely competitive pricing in the
marketplace and dramatic increases in the costs
of the goods we sell, due mostly to rapid changes
in manufacturer policies.These increased costs
occurred so quickly and profoundly that the
industry was not able to reflect the changes in
market prices.As a result, our profitability was
negatively impacted.While we are proud to
achieve net income of $183 million in a year in
which most of our competitors did not produce
profits, we did not achieve our objective of
continued profitable growth.
We exit 1999 in a position of financial
strength.The company’s capital position
improved significantly during the year based
on good working capital management and
contributions to equity from earnings and
investment appreciation.Total debt declined
$372 million from the end of 1998 to $1.35
billion at the end of 1999. Stockholders’ Equity
increased $568 million from the end of 1998 to
$1.97 billion at the end of 1999, resulting
in a
ratio of balance sheet debt to total capitalization
of 41 percent.
Evolving Our Fundamental Strengths
Amidst short-term challenges in 1999, our
company remains the market leader and only
net income
figures in millions
1250
1500
2000
1000
750
500
250
0
$
‘98 ‘99‘97‘96‘95
stockholders’
equity
figures in millions
‘98 ‘99
25
30
20
15
10
5
0
$
‘97‘96‘95
net sales
figures in billions