ING Direct 2013 Annual Report Download - page 19
Download and view the complete annual report
Please find page 19 of the 2013 ING Direct annual report below. You can navigate through the pages in the report by either clicking on the pages listed below, or by using the keyword search tool below to find specific information within the annual report.-
 1
1 -
2
-
3
-
4
-
5
-
6
-
7
-
8
-
 9
9 -
 10
10 -
 11
11 -
 12
12 -
 13
13 -
 14
14 -
 15
15 -
 16
16 -
 17
17 -
 18
18 -
 19
19 -
 20
20 -
 21
21 -
 22
22 -
 23
23 -
 24
24 -
 25
25 -
 26
26 -
 27
27 -
 28
28 -
 29
29 -
30
-
31
-
32
-
33
-
34
-
35
-
36
-
37
-
38
-
39
-
40
-
41
-
42
-
43
-
44
-
45
-
46
-
47
-
48
-
49
-
50
-
51
-
52
-
53
-
54
-
55
-
56
-
57
-
58
-
59
-
60
-
61
-
62
-
63
-
64
-
65
-
66
-
67
-
68
-
69
-
70
-
71
-
72
-
73
-
74
-
75
-
76
-
77
-
78
-
79
-
80
-
81
-
82
-
83
-
84
-
85
-
86
-
87
-
88
-
89
-
90
-
91
-
92
-
93
-
94
-
95
-
96
-
97
-
98
-
99
-
100
-
101
-
102
-
103
-
104
-
105
-
106
-
107
-
108
-
109
-
110
-
111
-
112
-
113
-
114
-
115
-
116
-
117
-
118
-
119
-
120
-
121
-
122
-
123
-
124
-
125
-
126
-
127
-
128
-
129
-
130
-
131
-
132
-
133
-
134
-
135
-
136
-
137
-
138
-
139
-
140
-
141
-
142
-
143
-
144
-
145
-
146
-
147
-
148
-
149
-
150
-
151
-
152
-
153
-
154
-
155
-
156
-
157
-
158
-
159
-
160
-
161
-
162
-
163
-
164
-
165
-
166
-
167
-
168
-
169
-
170
-
171
-
172
-
173
-
174
-
175
-
176
-
177
-
178
-
179
-
180
-
181
-
182
-
183
-
184
-
185
-
186
-
187
-
188
-
189
-
190
-
191
-
192
-
193
-
194
-
195
-
196
-
197
-
198
-
199
-
200
-
201
-
202
-
203
-
204
-
205
-
206
-
207
-
208
-
209
-
210
-
211
-
212
-
213
-
214
-
215
-
216
-
217
-
218
-
219
-
220
-
221
-
222
-
223
-
224
-
225
-
226
-
227
-
228
-
229
-
230
-
231
-
232
-
233
-
234
-
235
-
236
-
237
-
238
-
239
-
240
-
241
-
242
-
243
-
244
-
245
-
246
-
247
-
248
-
249
-
250
-
251
-
252
-
253
-
254
-
255
-
256
-
257
-
258
-
259
-
260
-
261
-
262
-
263
-
264
-
265
-
266
-
267
-
268
-
269
-
270
-
271
-
272
-
273
-
274
-
275
-
276
-
277
-
278
-
279
-
280
-
281
-
282
-
283
-
284
-
285
-
286
-
287
-
288
-
289
-
290
-
291
-
292
-
293
-
294
-
295
-
296
-
297
-
298
-
299
-
300
-
301
-
302
-
303
-
304
-
305
-
306
-
307
-
308
-
309
-
310
-
311
-
312
-
313
-
314
-
315
-
316
-
317
-
318
-
319
-
320
-
321
-
322
-
323
-
324
-
325
-
326
-
327
-
328
-
329
-
330
-
331
-
332
-
333
-
334
-
335
-
336
-
337
-
338
-
339
-
340
-
341
-
342
-
343
-
344
-
345
-
346
-
347
-
348
-
349
-
350
-
351
-
352
-
353
-
354
-
355
-
356
-
357
-
358
-
359
-
360
-
361
-
362
-
363
-
364
-
365
-
366
-
367
-
368
-
369
-
370
-
371
-
372
-
373
-
374
-
375
-
376
-
377
-
378
-
379
-
380
-
381
-
382
-
383
-
384
-
385
-
386
-
387
-
388
-
389
-
390
-
391
-
392
-
393
-
394
-
395
-
396
-
397
-
398
-
399
-
400
-
401
-
402
-
403
-
404
-
405
-
406
-
407
-
408
-
409
-
410
-
411
-
412
-
413
-
414
-
415
-
416
-
417
-
418
-
419
-
420
-
421
-
422
-
423
-
424
 |
 |

Our strong funding position enabled us to continue supporting
ourcustomers through lending in 2013.
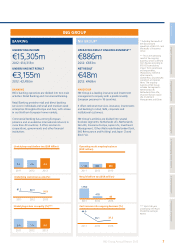
Strong cost control continues to be a priority at the Bank in order
toremain competitive and to be able to face external factors, such
as high regulatory costs and bank taxes. The underlying cost/
income ratio improved from 60.3% in 2012 to 56.8% in 2013.
Results at NN Group showed significant improvement in 2013, on
an operating basis. The improvement reflects a higher investment
margin following the partial transfer of assets and liabilities from
WestlandUtrecht Bank to Nationale-Nederlanden Bank, lower
expenses resulting from the transformation programme in the
Benelux, improved results in the non-life business and lower
funding costs.
STRONG PROGRESS ON RESTRUCTURING PLAN AND
REVISION OF TIMELINES
During 2013, ING made progress on its Restructuring Plan to fully
separate its banking and insurance and investment management
activities. We reached several milestones, for example:
• A successful initial public offering (IPO) of the US insurance
business (ING U.S.).
• Completion of the divestment of ING Insurance/IM Asia.
• An agreement in November 2013 with the EC on revised
timelines for the European and Japanese Insurance divestments,
which together formed ING Insurance and were renamed
NNGroup on 1 March 2014.
The preparations for the base case IPO of NN Group are
progressing well, which is expected to allow us to go to the market
in 2014.
DELIVERING ON RESTRUCTURING
ING continued to make strong progress on its restructuring
programme in 2013, entering the end-phase of its transformation.
To meet the agreement with the European Commission (EC) of
November 2012, ING had to divest more than 50% of its Asian and
25% of its US insurance and investment management activities by
2013. Both requirements were met:
• The divestment of the Asian insurance and investment
management activities was effectively completed in 2013.
INGLife Japan will be included in the scope of the NN Group
base case IPO in 2014. In May 2013 ING U.S. started trading on
the New York Stock Exchange under the ticker symbol VOYA.
The successful sale of 38 million ING U.S. shares in October 2013
brought ING’s stake down to 57%. The divested 43% was more
than the required 25% and moved ING closer to meeting the
required divestment of over 50% by the end of 2014. 100% has
to be reached by year-end 2016.
ING was also able to reduce the core debt from EUR 7.1 billion at
year-end 2012 to EUR 5.0 billion at year-end 2013. This was due to
strong capital generation within ING Bank, allowing an upstream
payment to the Group, as well as to proceeds from the US IPO and
the sale of part of the direct stake in the Brazilian insurer Sul
América S.A. (SulAmérica).
As ING has committed to eliminate core debt, proceeds from the
divestments will be used to that end, provided they are not needed
to maintain the leverage of the remaining insurance businesses. The
value of the remaining 57% stake in ING U.S., the remaining stake
Strengths Weaknesses
• Positive recognition from
customers in many countries
for its banking and insurance
services.
• Solid financial position.
• Multi-channel distribution
strategy.
• International network.
• Sustainability leader in its sector.
Bank-specific
• Pioneer in digital banking.
• Well-known, strong brand.
• Subdued economic growth in
some of the core markets.
• Financial sector has an
unfavourable public image in
many countries.
Opportunities Threats
• Regaining trust and
demonstrating care, especially
towards customers.
• Transparency. Explaining better
why strategic choices are made.
• Cultural change. Tapping more
into the talents of employees.
Further developing a transparent
no-nonsense culture.
Bank-specific
• Frontrunner position in digital
solutions give the Bank an edge in
innovation.
• Ongoing uncertainty about
regulatory changes. Lack of
an international level playing field.
Bank-specific
• Possibly from new entrants from
outside of the industry.
ING’s solid foundations, based on a long legacy as a financial
institution, give us an excellent starting position to face existing and
future challenges, and to grasp opportunities to become a better
company for all our stakeholders. Specifically on the banking side
of the business, we strive to make optimal use of our leading
position in digital banking.
STRENGTHENING THE FINANCIAL POSITION
ING places great importance on strengthening its financial position
in order to put itself in the best position to facilitate the economy.
In 2013 we gained financial strength. Capital and funding
improved, our liquidity position remained strong, earnings
remained resilient. However, risk costs went up slightly in a weak
economic year in many of the markets in which we operate.
In January 2012, the Bank unveiled Ambition 2015, a set of
aspirations that included increasing our capital. Attaining a core
Tier 1 capital ratio under Basel III of at least 10% by 2013 was a
target we managed to sustain throughout 2013. At year-end, it
stood at 11.7% under Basel II and 10.0% on a fully loaded
pro-forma basis under Basel III. The leverage ratio under Basel III
was 3.9%, which is also in line with Ambition 2015 (4.0%) and
already complies with the CRD IV threshold of 3.0% by 2015.
ING Bank is making clear progress on meeting the other regulatory
CRD IV-requirements, and other aspects of Ambition 2015. For
example, ING maintained a liquidity coverage ratio of more than
100% in 2013; a level we aimed at for 2015. Also, the targeted
balance sheet optimisation at ING Bank is substantially complete.
ING Bank’s underlying result before tax was mainly driven by a
strengthening of the interest margin, less volatility in credit and
debt valuation adjustments (“CVA/DVA”) in Commercial Banking
and the Corporate Line, and the absence of de-risking losses in
2013. The profitability of ING Bank went up: the underlying return
on IFRS-EU equity was 9.0% in 2013, which is higher than it was in
2012 (7.0%) and brings our 2015 target within reach (10 to 13%).
17ING Group Annual Report 2013
1 Who we are 2 Report of the Executive Board 3 Corporate governance 4 Consolidated annual accounts 5 Parent company annual accounts 6 Other information 7 Additional information