Hyundai 2006 Annual Report Download - page 97
Download and view the complete annual report
Please find page 97 of the 2006 Hyundai annual report below. You can navigate through the pages in the report by either clicking on the pages listed below, or by using the keyword search tool below to find specific information within the annual report.-
 1
1 -
2
-
3
-
4
-
5
-
6
-
7
-
8
-
9
-
10
-
11
-
12
-
13
-
14
-
15
-
16
-
17
-
18
-
19
-
20
-
21
-
22
-
23
-
24
-
25
-
26
-
27
-
28
-
29
-
30
-
31
-
32
-
33
-
34
-
35
-
36
-
37
-
38
-
39
-
40
-
41
-
42
-
43
-
44
-
45
-
46
-
47
-
48
-
49
-
50
-
51
-
52
-
53
-
54
-
55
-
56
-
57
-
58
-
59
-
60
-
61
-
62
-
63
-
64
-
65
-
66
-
67
-
68
-
69
-
70
-
71
-
72
-
73
-
74
-
75
-
76
-
77
-
78
-
79
-
80
-
81
-
82
-
83
-
84
-
85
-
86
-
 87
87 -
 88
88 -
 89
89 -
 90
90 -
 91
91 -
 92
92 -
 93
93 -
 94
94 -
 95
95 -
 96
96 -
 97
97 -
 98
98 -
 99
99 -
 100
100 -
 101
101 -
 102
102 -
 103
103 -
 104
104 -
 105
105 -
 106
106 -
 107
107 -
108
-
109
-
110
-
111
-
112
-
113
-
114
-
115
-
116
-
117
-
118
-
119
-
120
-
121
-
122
-
123
-
124
-
125
-
126
-
127
-
128
-
129
-
130
-
131
-
132
-
133
-
134
-
135
 |
 |

93
HYUNDAI MOTOR COMPANY AND SUBSIDIARIES
NOTES TO CONSOLIDATED FINANCIAL STATEMENTS
FOR THE YEARS ENDED DECEMBER 31, 2006 AND 2005
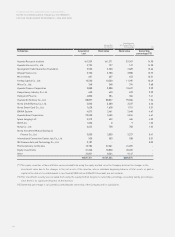
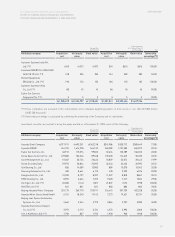
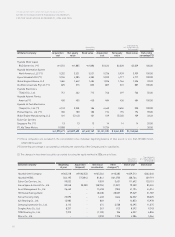
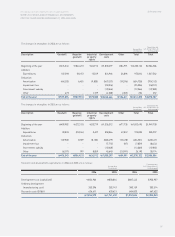
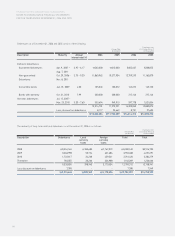
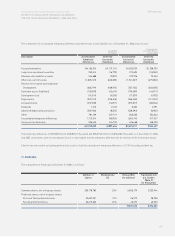
The changes in property, plant and equipment in 2006 are as follows:
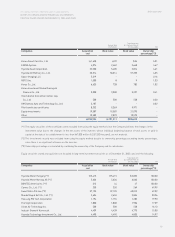
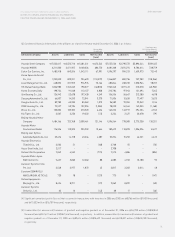
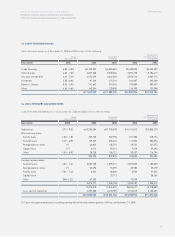
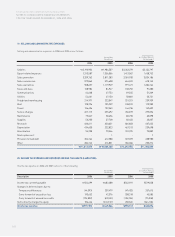
9. PROPERTY, PLANT AND EQUIPMENT:
Property, plant and equipments as of December 31, 2006 and 2005 consist of the following:
Korean Won
(In millions)
Translation into
U.S. Dollars (Note 2)
(In thousands)
Description 2006 2005 2006 2005
Buildings and structures 7,531,889 7,078,546 $8,102,290 $7,614,615
Machinery and equipment 12,353,513 11,508,182 13,289,063 12,379,714
Vehicles 189,863 212,382 204,242 228,466
Tools, dies and molds 3,570,875 4,392,993 3,841,303 4,725,681
Other equipment 1,424,757 1,310,013 1,532,656 1,409,222
25,070,897 24,502,116 26,969,554 26,357,698
Less: accumulated depreciation 8,348,614 9,891,942 8,980,867 10,641,073
16,722,283 14,610,174 17,988,687 15,716,625
Land 4,262,913 4,165,180 4,585,750 4,480,615
Construction in progress 2,506,397 2,672,685 2,696,210 2,875,091
23,491,593 21,448,039 $25,270,647 $23,072,331
Translation into
U.S. Dollars (Note 2)
(In thousands)
Korean Won
(In millions)
Beginning Acquisition Transfer Disposal Depreciation Other(*) End of End of
of year year year
Land 4,165,180 67,260 58,234 (42,110) (2,042) 16,391 4,262,913 $4,585,750
Buildings and structures 5,725,824 106,537 895,640 (17,244) (300,362) (29,440) 6,380,955 6,864,194
Machinery and equipment 6,959,868 234,597 2,003,084 (104,670) (1,247,461) 350,964 8,196,382 8,817,106
Vehicles 130,471 13,971 36,420 (22,882) (41,636) 5,694 122,038 131,280
Tools, dies and molds 1,245,453 30,499 581,508 (4,995) (502,780) 19,989 1,369,674 1,473,401
Other equipment 548,558 38,042 127,397 (72,248) (222,747) 234,232 653,234 702,704
Construction in progress 2,672,685 3,378,480 (3,702,283) (22,510) - 180,025 2,506,397 2,696,212
21,448,039 3,869,386 -(286,659) (2,317,028) 777,855 23,491,593 $25,270,647
(*) Other includes foreign currency adjustment, changes in the scope of consolidation, impairment loss and transfer to other assets.