Hyundai 2006 Annual Report Download - page 102
Download and view the complete annual report
Please find page 102 of the 2006 Hyundai annual report below. You can navigate through the pages in the report by either clicking on the pages listed below, or by using the keyword search tool below to find specific information within the annual report.-
 1
1 -
2
-
3
-
4
-
5
-
6
-
7
-
8
-
9
-
10
-
11
-
12
-
13
-
14
-
15
-
16
-
17
-
18
-
19
-
20
-
21
-
22
-
23
-
24
-
25
-
26
-
27
-
28
-
29
-
30
-
31
-
32
-
33
-
34
-
35
-
36
-
37
-
38
-
39
-
40
-
41
-
42
-
43
-
44
-
45
-
46
-
47
-
48
-
49
-
50
-
51
-
52
-
53
-
54
-
55
-
56
-
57
-
58
-
59
-
60
-
61
-
62
-
63
-
64
-
65
-
66
-
67
-
68
-
69
-
70
-
71
-
72
-
73
-
74
-
75
-
76
-
77
-
78
-
79
-
80
-
81
-
82
-
83
-
84
-
85
-
86
-
87
-
88
-
89
-
90
-
91
-
 92
92 -
 93
93 -
 94
94 -
 95
95 -
 96
96 -
 97
97 -
 98
98 -
 99
99 -
 100
100 -
 101
101 -
 102
102 -
 103
103 -
 104
104 -
 105
105 -
 106
106 -
 107
107 -
 108
108 -
 109
109 -
 110
110 -
 111
111 -
 112
112 -
113
-
114
-
115
-
116
-
117
-
118
-
119
-
120
-
121
-
122
-
123
-
124
-
125
-
126
-
127
-
128
-
129
-
130
-
131
-
132
-
133
-
134
-
135
 |
 |

98
HYUNDAI MOTOR COMPANY AND SUBSIDIARIES
NOTES TO CONSOLIDATED FINANCIAL STATEMENTS
FOR THE YEARS ENDED DECEMBER 31, 2006 AND 2005
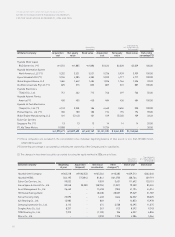
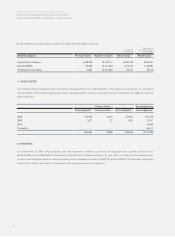
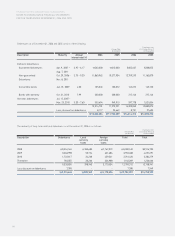
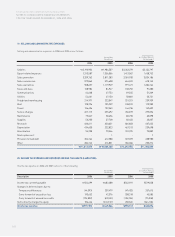
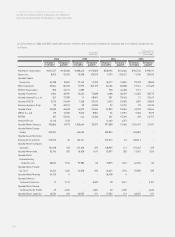
Debentures as of December 31, 2006 and 2005 consist of the following:
Korean Won
(In millions)
Translation into
U.S. Dollars (Note 2)
(In thousands)
Description Maturity Annual 2006 2005 2006 2005
interest rate (%)
Domestic debentures:
Guaranteed debentures Apr. 9, 2007 ~ 3.95 ~ 6.17 563,000 315,000 $605,637 $338,855
Aug. 7, 2011
Non-guaranteed Oct. 29, 2006 ~ 3.75 ~ 9.20 11,860,962 10,377,934 12,759,210 11,163,870
Debentures Nov. 8, 2011
Convertible bonds Jan. 31, 2009 4.00 135,045 133,072 145,272 143,150
Bonds with warranty Oct. 31, 2010 7.99 200,000 200,000 215,146 215,146
Overseas debentures Jul. 15, 2007 ~
Mar. 25, 2015 5.30 ~ 7.60 555,694 949,915 597,778 1,021,854
13,314,701 11,975,921 14,323,043 12,882,875
Less; discount on debentures 8,117 25,662 8,731 27,605
13,306,584 11,950,259 $14,314,312 $12,855,270
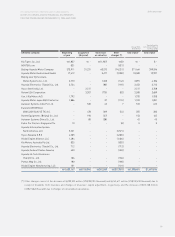
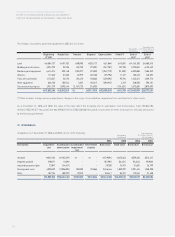
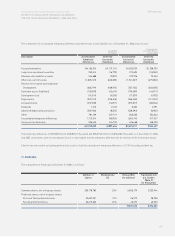
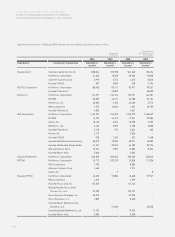
The maturity of long-term debt and debentures as of December 31, 2006 is as follows:
Korean Won
(In millions)
Translation into
U.S. Dollars (Note 2)
(In thousands)
Description Debentures Local Foreign Total Total
currency currency
loans loans
2008 3,554,165 183,685 1,762,319 5,500,169 $5,916,705
2009 3,260,998 50,724 621,686 3,933,408 4,231,291
2010 1,722,617 34,268 459,541 2,216,426 2,384,279
Thereafter 783,055 30,266 326,988 1,140,309 1,226,666
9,320,835 298,943 3,170,534 12,790,312 13,758,941
Less discount on debentures 7,390 - - 7,390 7,949
9,313,445 298,943 3,170,534 12,782,922 $13,750,992