Huntington National Bank 2011 Annual Report Download - page 5
Download and view the complete annual report
Please find page 5 of the 2011 Huntington National Bank annual report below. You can navigate through the pages in the report by either clicking on the pages listed below, or by using the keyword search tool below to find specific information within the annual report.-
 1
1 -
 2
2 -
 3
3 -
 4
4 -
 5
5 -
 6
6 -
 7
7 -
 8
8 -
 9
9 -
 10
10 -
 11
11 -
 12
12 -
 13
13 -
 14
14 -
 15
15 -
 16
16 -
17
-
18
-
19
-
20
-
21
-
22
-
23
-
24
-
25
-
26
-
27
-
28
-
29
-
30
-
31
-
32
-
33
-
34
-
35
-
36
-
37
-
38
-
39
-
40
-
41
-
42
-
43
-
44
-
45
-
46
-
47
-
48
-
49
-
50
-
51
-
52
-
53
-
54
-
55
-
56
-
57
-
58
-
59
-
60
-
61
-
62
-
63
-
64
-
65
-
66
-
67
-
68
-
69
-
70
-
71
-
72
-
73
-
74
-
75
-
76
-
77
-
78
-
79
-
80
-
81
-
82
-
83
-
84
-
85
-
86
-
87
-
88
-
89
-
90
-
91
-
92
-
93
-
94
-
95
-
96
-
97
-
98
-
99
-
100
-
101
-
102
-
103
-
104
-
105
-
106
-
107
-
108
-
109
-
110
-
111
-
112
-
113
-
114
-
115
-
116
-
117
-
118
-
119
-
120
-
121
-
122
-
123
-
124
-
125
-
126
-
127
-
128
-
129
-
130
-
131
-
132
-
133
-
134
-
135
-
136
-
137
-
138
-
139
-
140
-
141
-
142
-
143
-
144
-
145
-
146
-
147
-
148
-
149
-
150
-
151
-
152
-
153
-
154
-
155
-
156
-
157
-
158
-
159
-
160
-
161
-
162
-
163
-
164
-
165
-
166
-
167
-
168
-
169
-
170
-
171
-
172
-
173
-
174
-
175
-
176
-
177
-
178
-
179
-
180
-
181
-
182
-
183
-
184
-
185
-
186
-
187
-
188
-
189
-
190
-
191
-
192
-
193
-
194
-
195
-
196
-
197
-
198
-
199
-
200
-
201
-
202
-
203
-
204
-
205
-
206
-
207
-
208
-
209
-
210
-
211
-
212
-
213
-
214
-
215
-
216
-
217
-
218
-
219
-
220
-
221
-
222
-
223
-
224
-
225
-
226
-
227
-
228
-
229
-
230
-
231
-
232
-
233
-
234
-
235
-
236
 |
 |
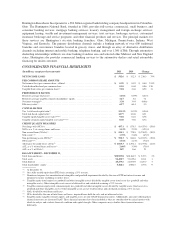
The decline in noninterest income was driven by a $92.4 million, or 53%, decrease in mortgage banking
income and $23.5 million, or 9%, decrease in service charges on deposit accounts, due to the implementation of
the Amendment to Reg. E and our “Fair Play” consumer banking initiatives. Importantly, consumer checking
households and commercial relationships grew at record paces, such that service charges on deposit accounts in
2011 fourth quarter were 13% higher than in the year earlier quarter. Other areas of fee income benefited from
our customer growth and cross-sell strategy. This included brokerage, trust services, and capital markets whose
combined revenue increased $31.0 million, or 15%, over 2010. For the year, gain on sale of loans increased
$25.7 million due to a $15.5 million automobile loan securitization gain and continued strengthening in our
Small Business Administration (SBA) related activities. We are now the No. 3 SBA lender in the nation for the
number of SBA 7(a) loans and remain No. 1 in our Midwest states.
Fully-taxable equivalent net interest income reached record levels, reflecting the favorable impact of a $1.2
billion, or 2%, increase in average earning assets, partially offset by a 6 basis point decline in the net interest
margin. Average earning asset growth benefited from a $1.6 billion, or 4%, increase in average total loans and
leases partially offset by a $0.4 billion, or 4%, decrease in average total available-for-sale and other securities.
2011 marked the first year since 2008 that we experienced growth in average loans. Average C&I loans increased
$1.2 billion, or 9%, with average automobile loans and leases increasing $1.0 billion, or 20%. This growth was
partially offset by a $1.0 billion decrease in average commercial real estate loans.
During the second half of the year, we reached two critical milestones in the remixing of the loan portfolio
to align with our long-term view of balancing risk exposures. First, during the third quarter, we reinstituted our
automobile loan securitization program. This permits us to continue to expand this business and related revenue
while maintaining the portfolio concentration risk for these types of loans at appropriate levels. Second, by the
end of the fourth quarter, commercial real estate loans reached $5.8 billion, with the decline slowing to just over
$0.1 billion from the prior quarter, as originations were at their highest level in several years. We are near the
inflection point in reducing our total commercial real estate loans.
Our fully-taxable equivalent net interest margin declined to 3.38% from 3.44%, due in large part to lower
loan and securities yields, partially offset by the positive impacts of growth in low-cost deposits and lower
deposit pricing. Average total deposits grew $1.5 billion, or 4%. We remained focused on growing total core
deposits, which increased $1.9 billion, or 5%, and in particular noninterest-bearing demand deposits, which
increased $1.8 billion, or 26%. Simultaneously, we reduced our reliance on higher cost noncore funding with a
$0.2 billion, or 33%, decline in average other domestic deposits of $250,000 or more.
Noninterest expense increased $54.7 million, or 3%, in 2011. This reflected increases in personnel costs,
expenses associated with the conversion to a new debit card processor, and the costs related to implementation of
strategic initiatives. These increases were partially offset by declines in OREO and foreclosure expenses as credit
quality continued to improve, as well as lower professional services costs.
Absent a significant decline in the economy, we feel we have turned the corner on credit. In 2011, the
provision for credit losses was $174.1 million and represented 0.45% of average loans, down from 1.70% in
2010. The 2011 provision as a percentage of average loans is consistent with our longer-term expectations. Net
charge-offs declined 50%, with period end nonaccrual loans down 30%. Our allowance for credit losses as a
percent of loans and leases decreased to 2.60% at December 31, 2011, down from 3.39% at the end of 2010.
Importantly, however, the relative level of our allowance for credit losses as a percent of nonaccrual loans
increased to 187% at the end of 2011, compared with 166% a year earlier.
Our tangible common equity ratio improved 74 basis points to 8.30%, and our Tier 1 common risk-based
capital ratio improved 71 basis points to 10.00% from December 31, 2010. For perspective, this was nearly
double the 5.05% level at the end of 2008. As a result of increasing bank capital standards arising from the
Dodd-Frank Act, beginning in 2013, trust preferred securities will eventually no longer qualify as Tier 1 capital.
Due to this change and our goal of maintaining a robust but efficient capital structure, in the 2011 fourth quarter
we issued $35.5 million of preferred stock in exchange for a portion of our trust preferred securities that were
3